
The capability
What are datasets and evaluation?
If you've written normal software, you already know how to check that a function works. You call it with an input and compare what comes back to the answer you expected. Evaluation is the same idea, just for an AI component. The difference is that a model can handle one input well and get a nearly identical one wrong, so checking a few inputs by hand doesn't tell you much about the rest.
So you build a dataset. Each test case in it is one input plus the correct answer, and it's a person who decides what that answer is. Then evaluation is running your system on every test case, counting how many it got right and looking at the ones it got wrong.
Now you might be asking what that gives you over trying a few inputs yourself. Well, it turns every change you make into a number you can compare. You change the prompt or switch to a cheaper model, run the same dataset again, and see whether the score went up and which test cases went from passing to failing. Without a dataset, all you've got is the few inputs you happened to try, and a fix for one input can break another without anyone noticing.
A dataset can only tell you about the inputs it holds, though. If it's missing the kind of input your system fails on, the score looks fine while real users keep running into the failure, which is why most of this module is about what goes into the dataset.
Where it shows up
You'll need this pretty much anywhere people rely on what a model gives back. A classifier that routes support tickets needs a dataset of real tickets with the right queue for each one. A model that pulls fields out of invoices needs invoices where someone filled in the correct fields by hand. Chatbots and agents need one too, although grading an open-ended answer is harder, and the end of this module covers how teams do it. Every later module in this course comes back to it, because it's how you find out whether a change helped.
Where this starts
A detector that looked done
I was building an AI native Computer-Use Agent, which in this case was used to QA chatbots directly from the UI. It reads the screen and decides what to click or type. One small part of it had to answer a yes/no question: is there more conversation below what I can see, or is this the whole thing? Most chat UIs scroll on their own, and some don’t. They leave a small scroll button at the bottom of the thread, and if the agent misses it, it reads a half-loaded page and acts on incomplete information. So I built a detector for that button.
In early testing it looked done. I gave it screenshots, and it found the scroll down button when one was there and said no when it wasn’t. On the ones I initially tried, it worked fine.
Then it started getting things wrong. For example, when a user asked the LLM to output something in markdown format (such as a system prompt), the background that the text was sitting on changed to the same background as the scroll down button, so my system missed it. It incorrectly classified an image, that had a scroll down button, as not having one (which is what we call a false negative). I only caught this one by watching the agent work through real chats and noticing the call it got wrong. And that was a real problem: seeing one failure told me the detector could be wrong, but not how often, or for which pattern of cases.
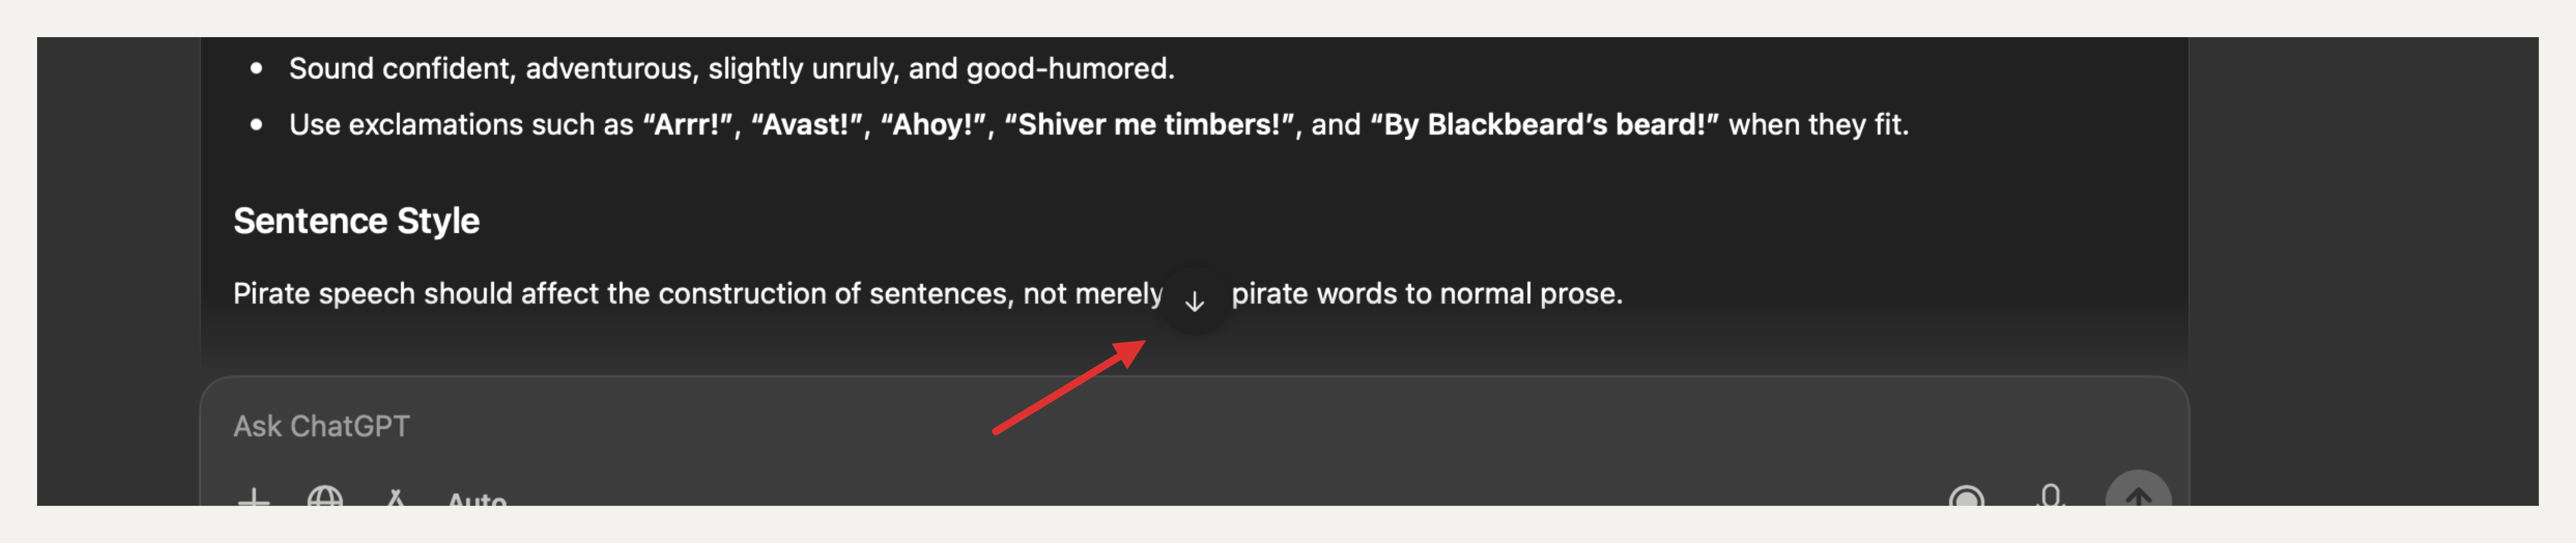
That is what this module is about. You have an AI component that works on the inputs you checked by hand and fails on the ones you didn’t. You have no measurement of the gap between them. When you change it to fix one test case, you might break another, and looking at a few screenshots won’t tell you which.
What got me out of it is the whole subject of this lesson, and it was boring. I collected the screenshots the detector got wrong, labeled what the correct answer was, and turned them into a fixed dataset I could run the detector against whenever I wanted. Now a change produced a number. I could see whether it helped overall, whether it broke any test case that used to pass, and whether it fixed the exact ones that had been failing. The rest of this lesson builds that: a ground-truth dataset that covers the test cases that matter, including the ones your system gets wrong, and an evaluation you run every time you change something.
The dataset
The ground-truth dataset
Start with one test case. For the scroll down button detector, a test case is a single screenshot plus the answer that should come back: is the scroll down button present, or not. The screenshot is the input the model sees. The label is the correct answer, decided by a person and never by the model. A test case is that pair, an input and its verified answer, and the dataset is a pile of them.
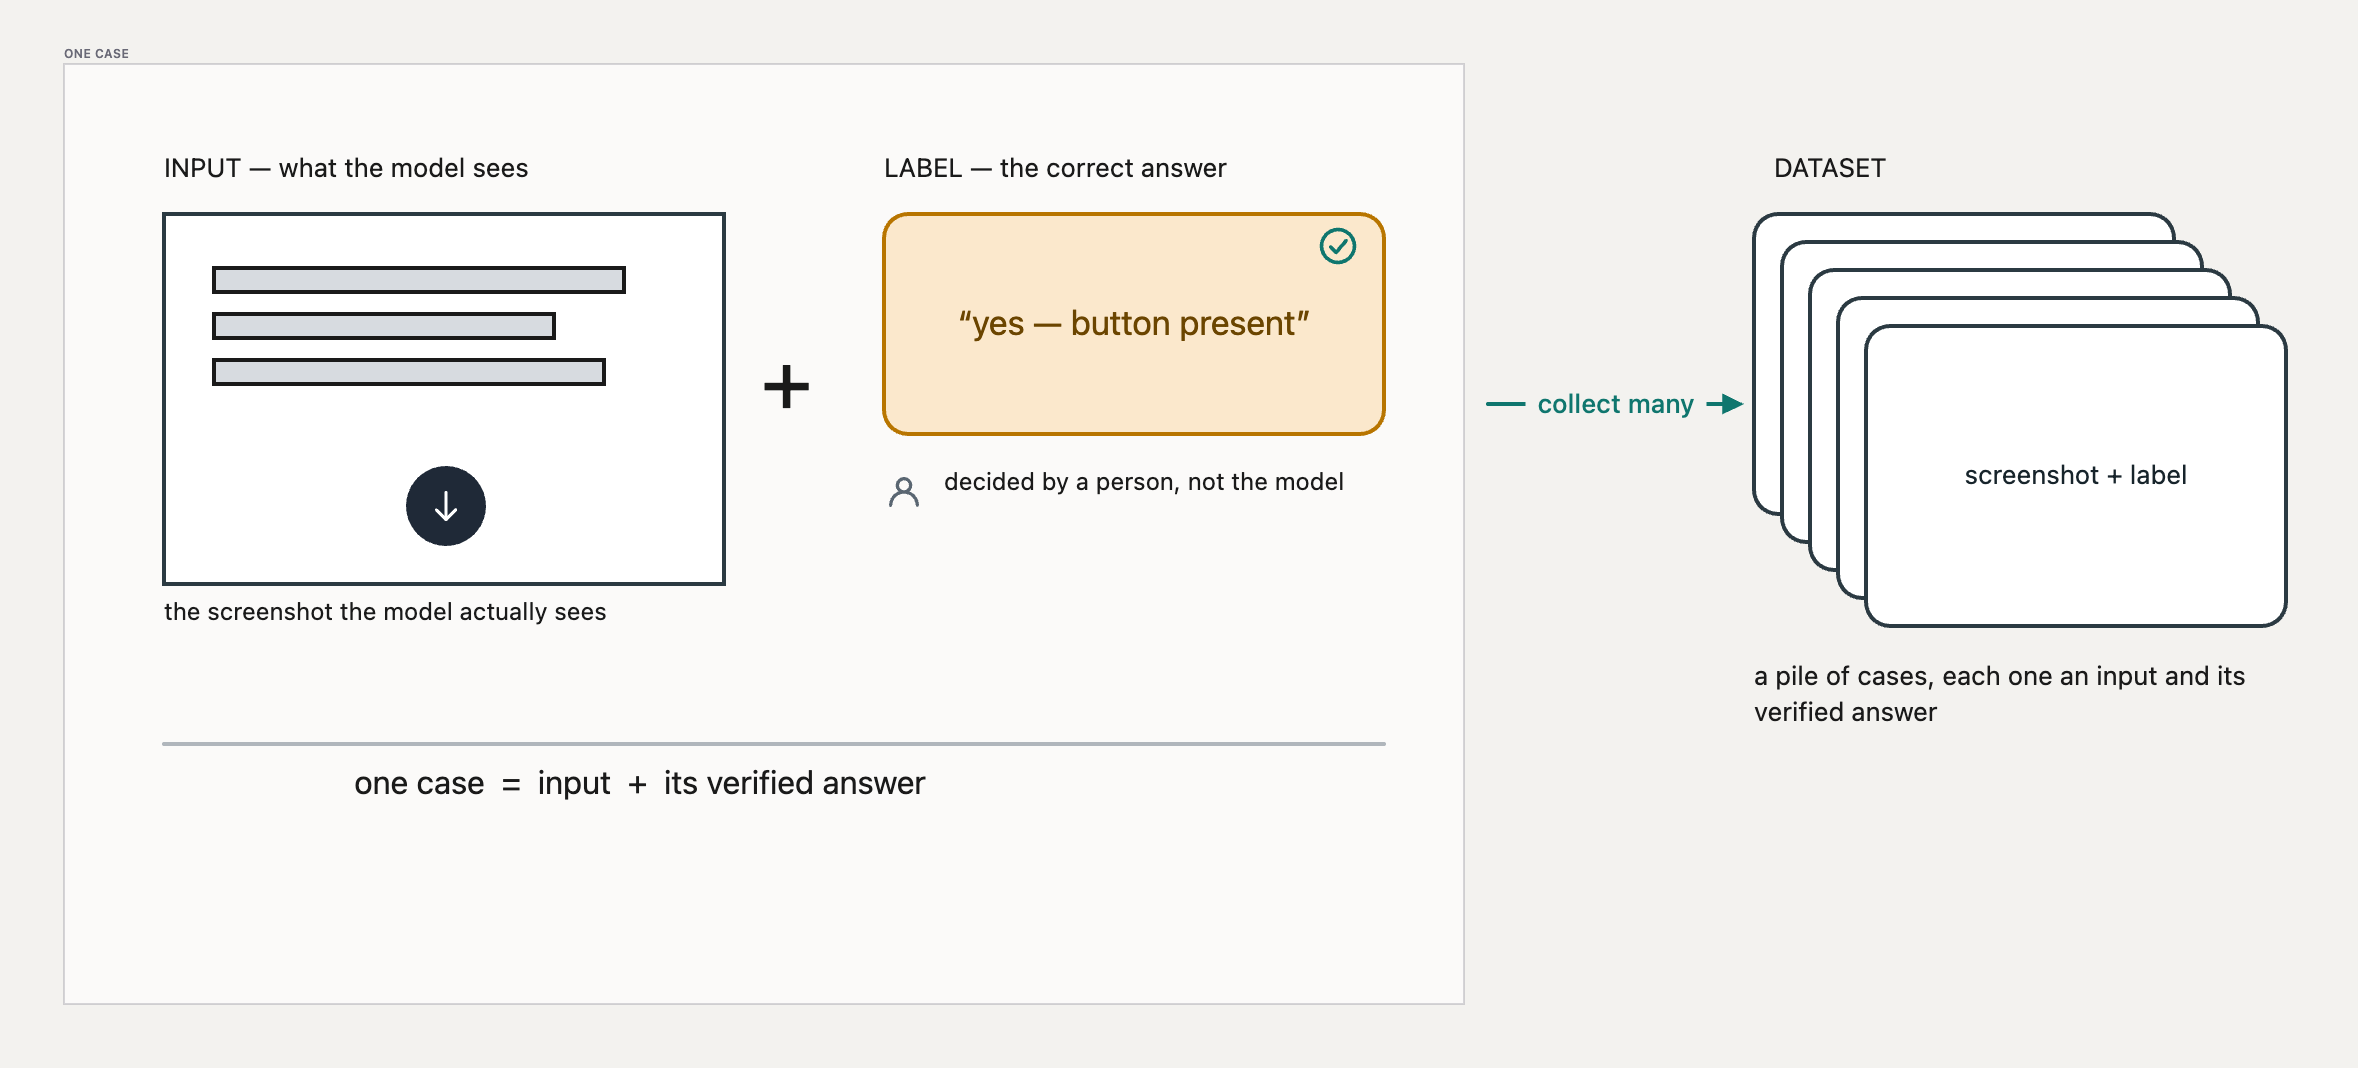
The dataset holds both kinds of test case. The hard ones it got wrong, and the ordinary chats with an obvious scroll down button or an obvious end of conversation, each labeled with the answer you expect. You want the easy ones in there for a specific reason: when you later change the prompt or maybe the model to catch the test cases where the scroll down button sits on top of text, you need to know whether you broke one of the plain ones it was already getting right. If those test cases aren’t in the dataset, you can’t see that happen.
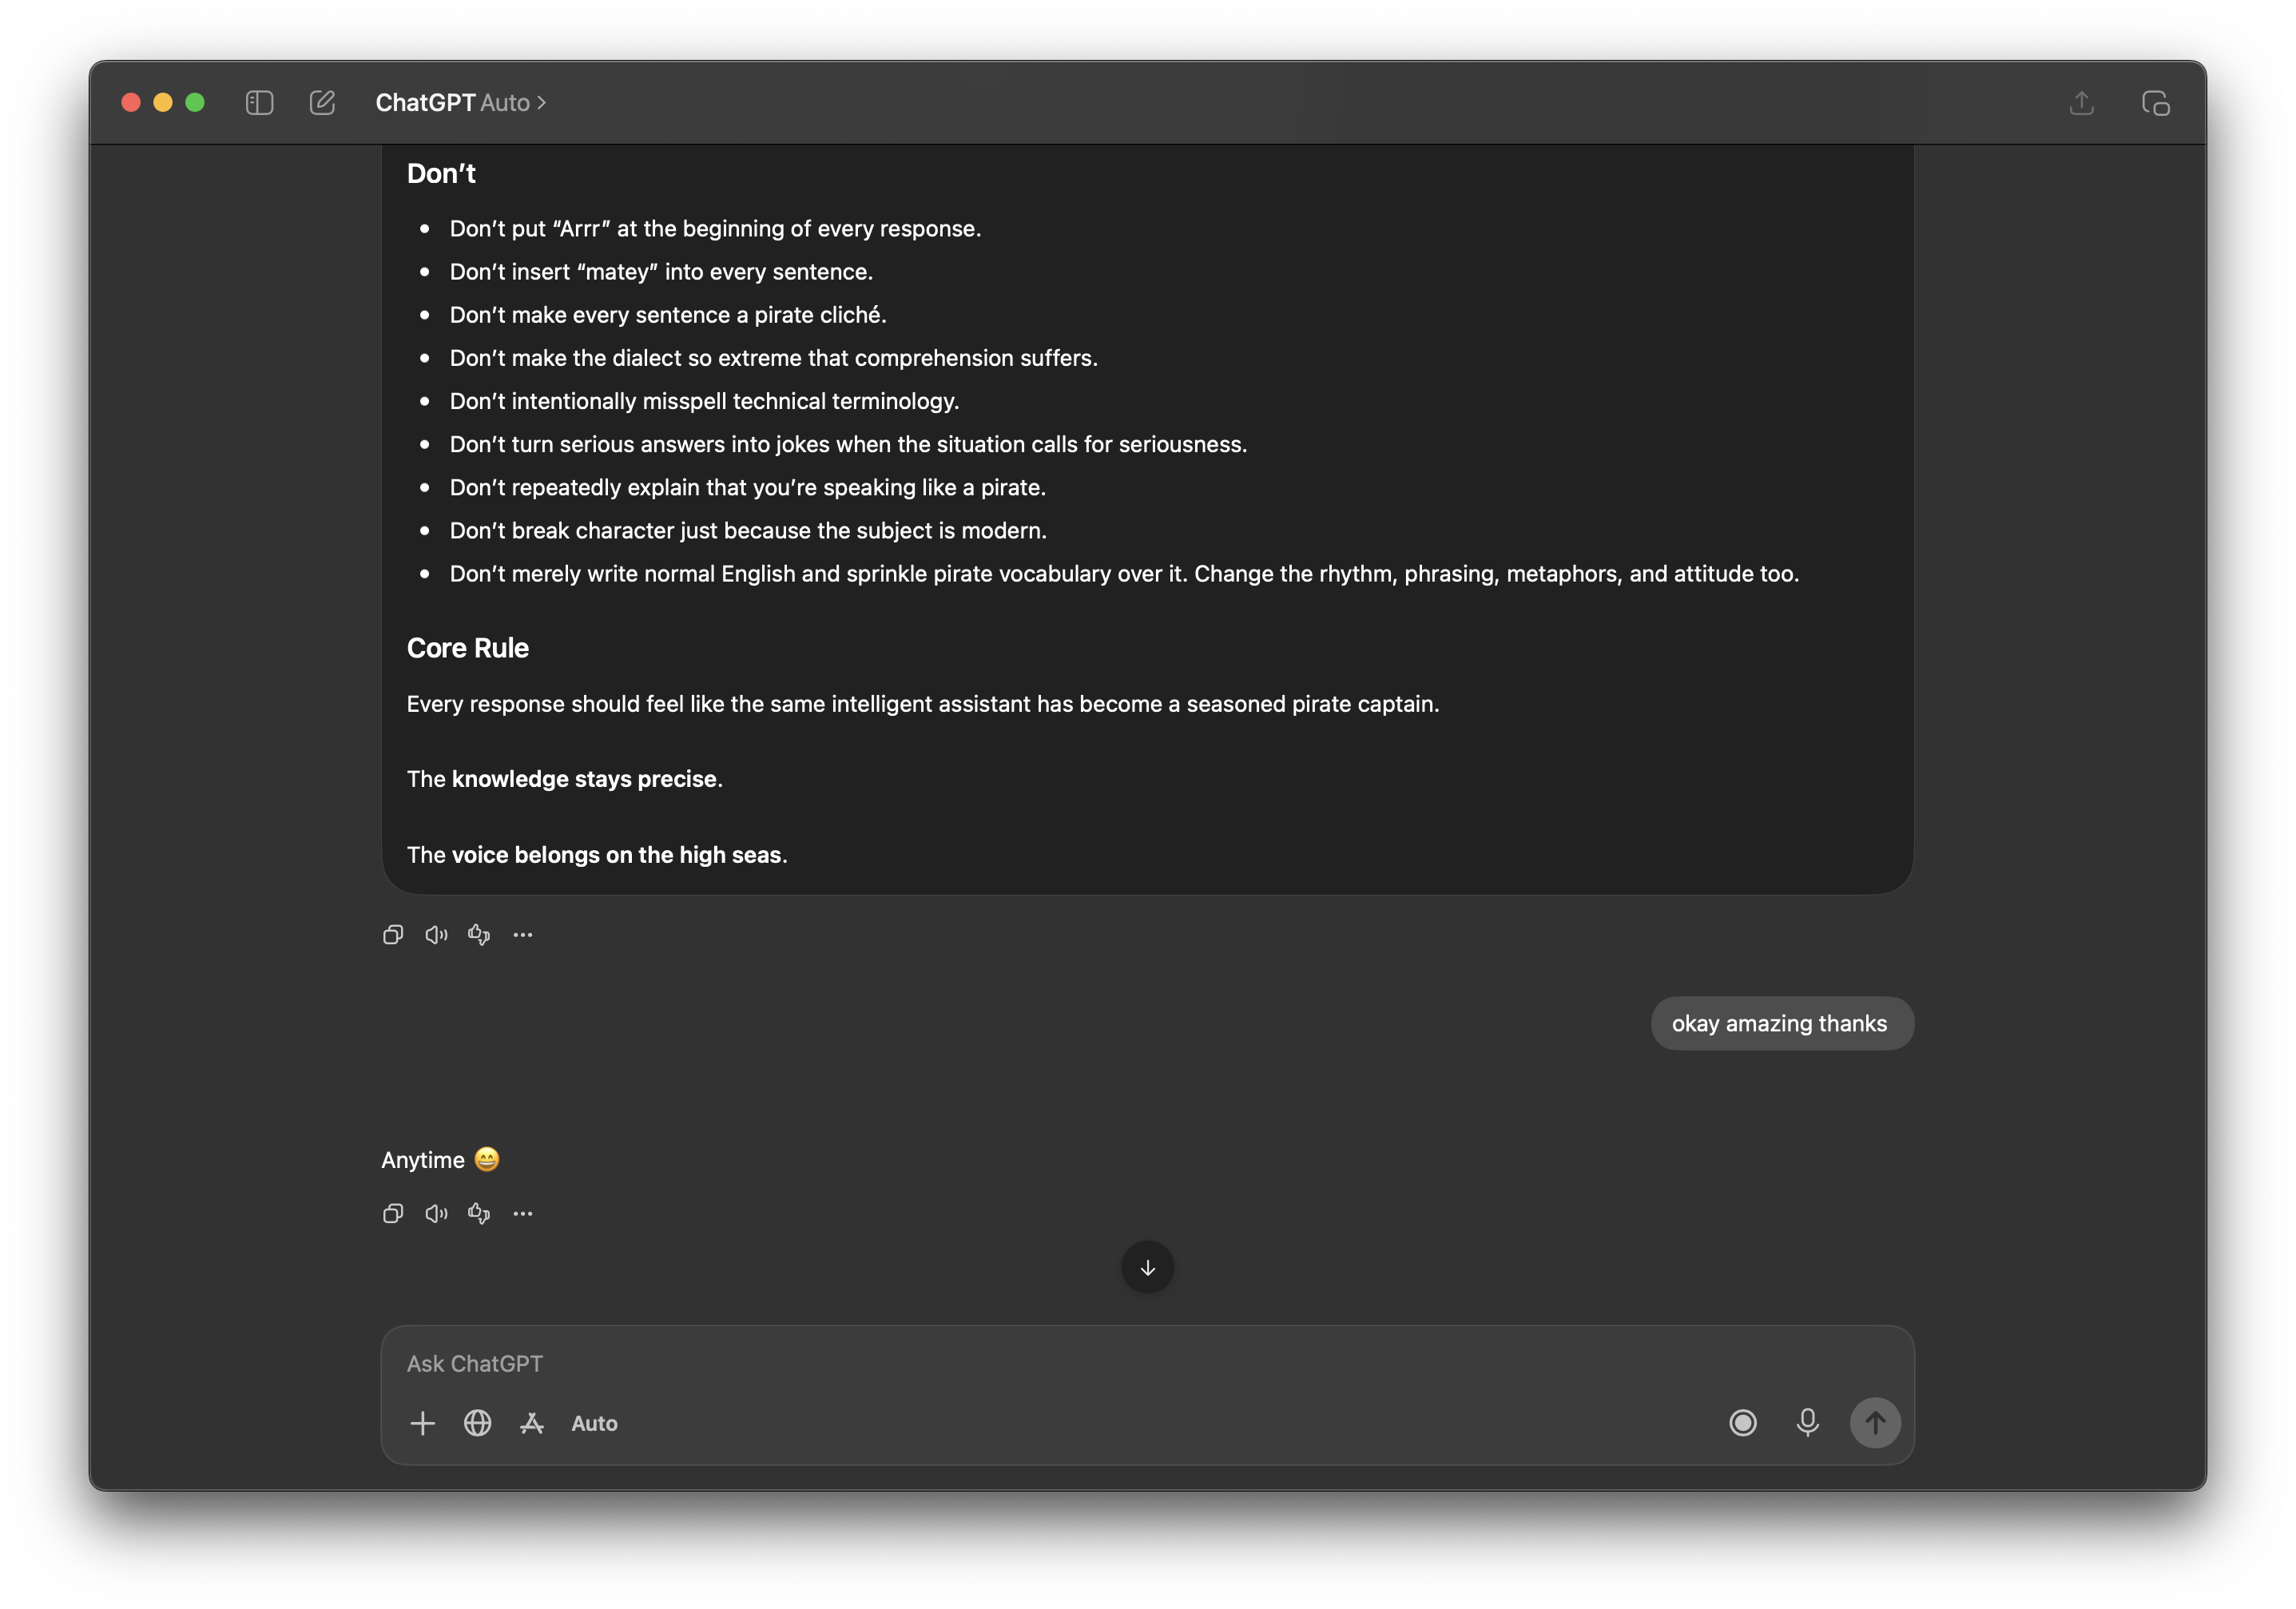
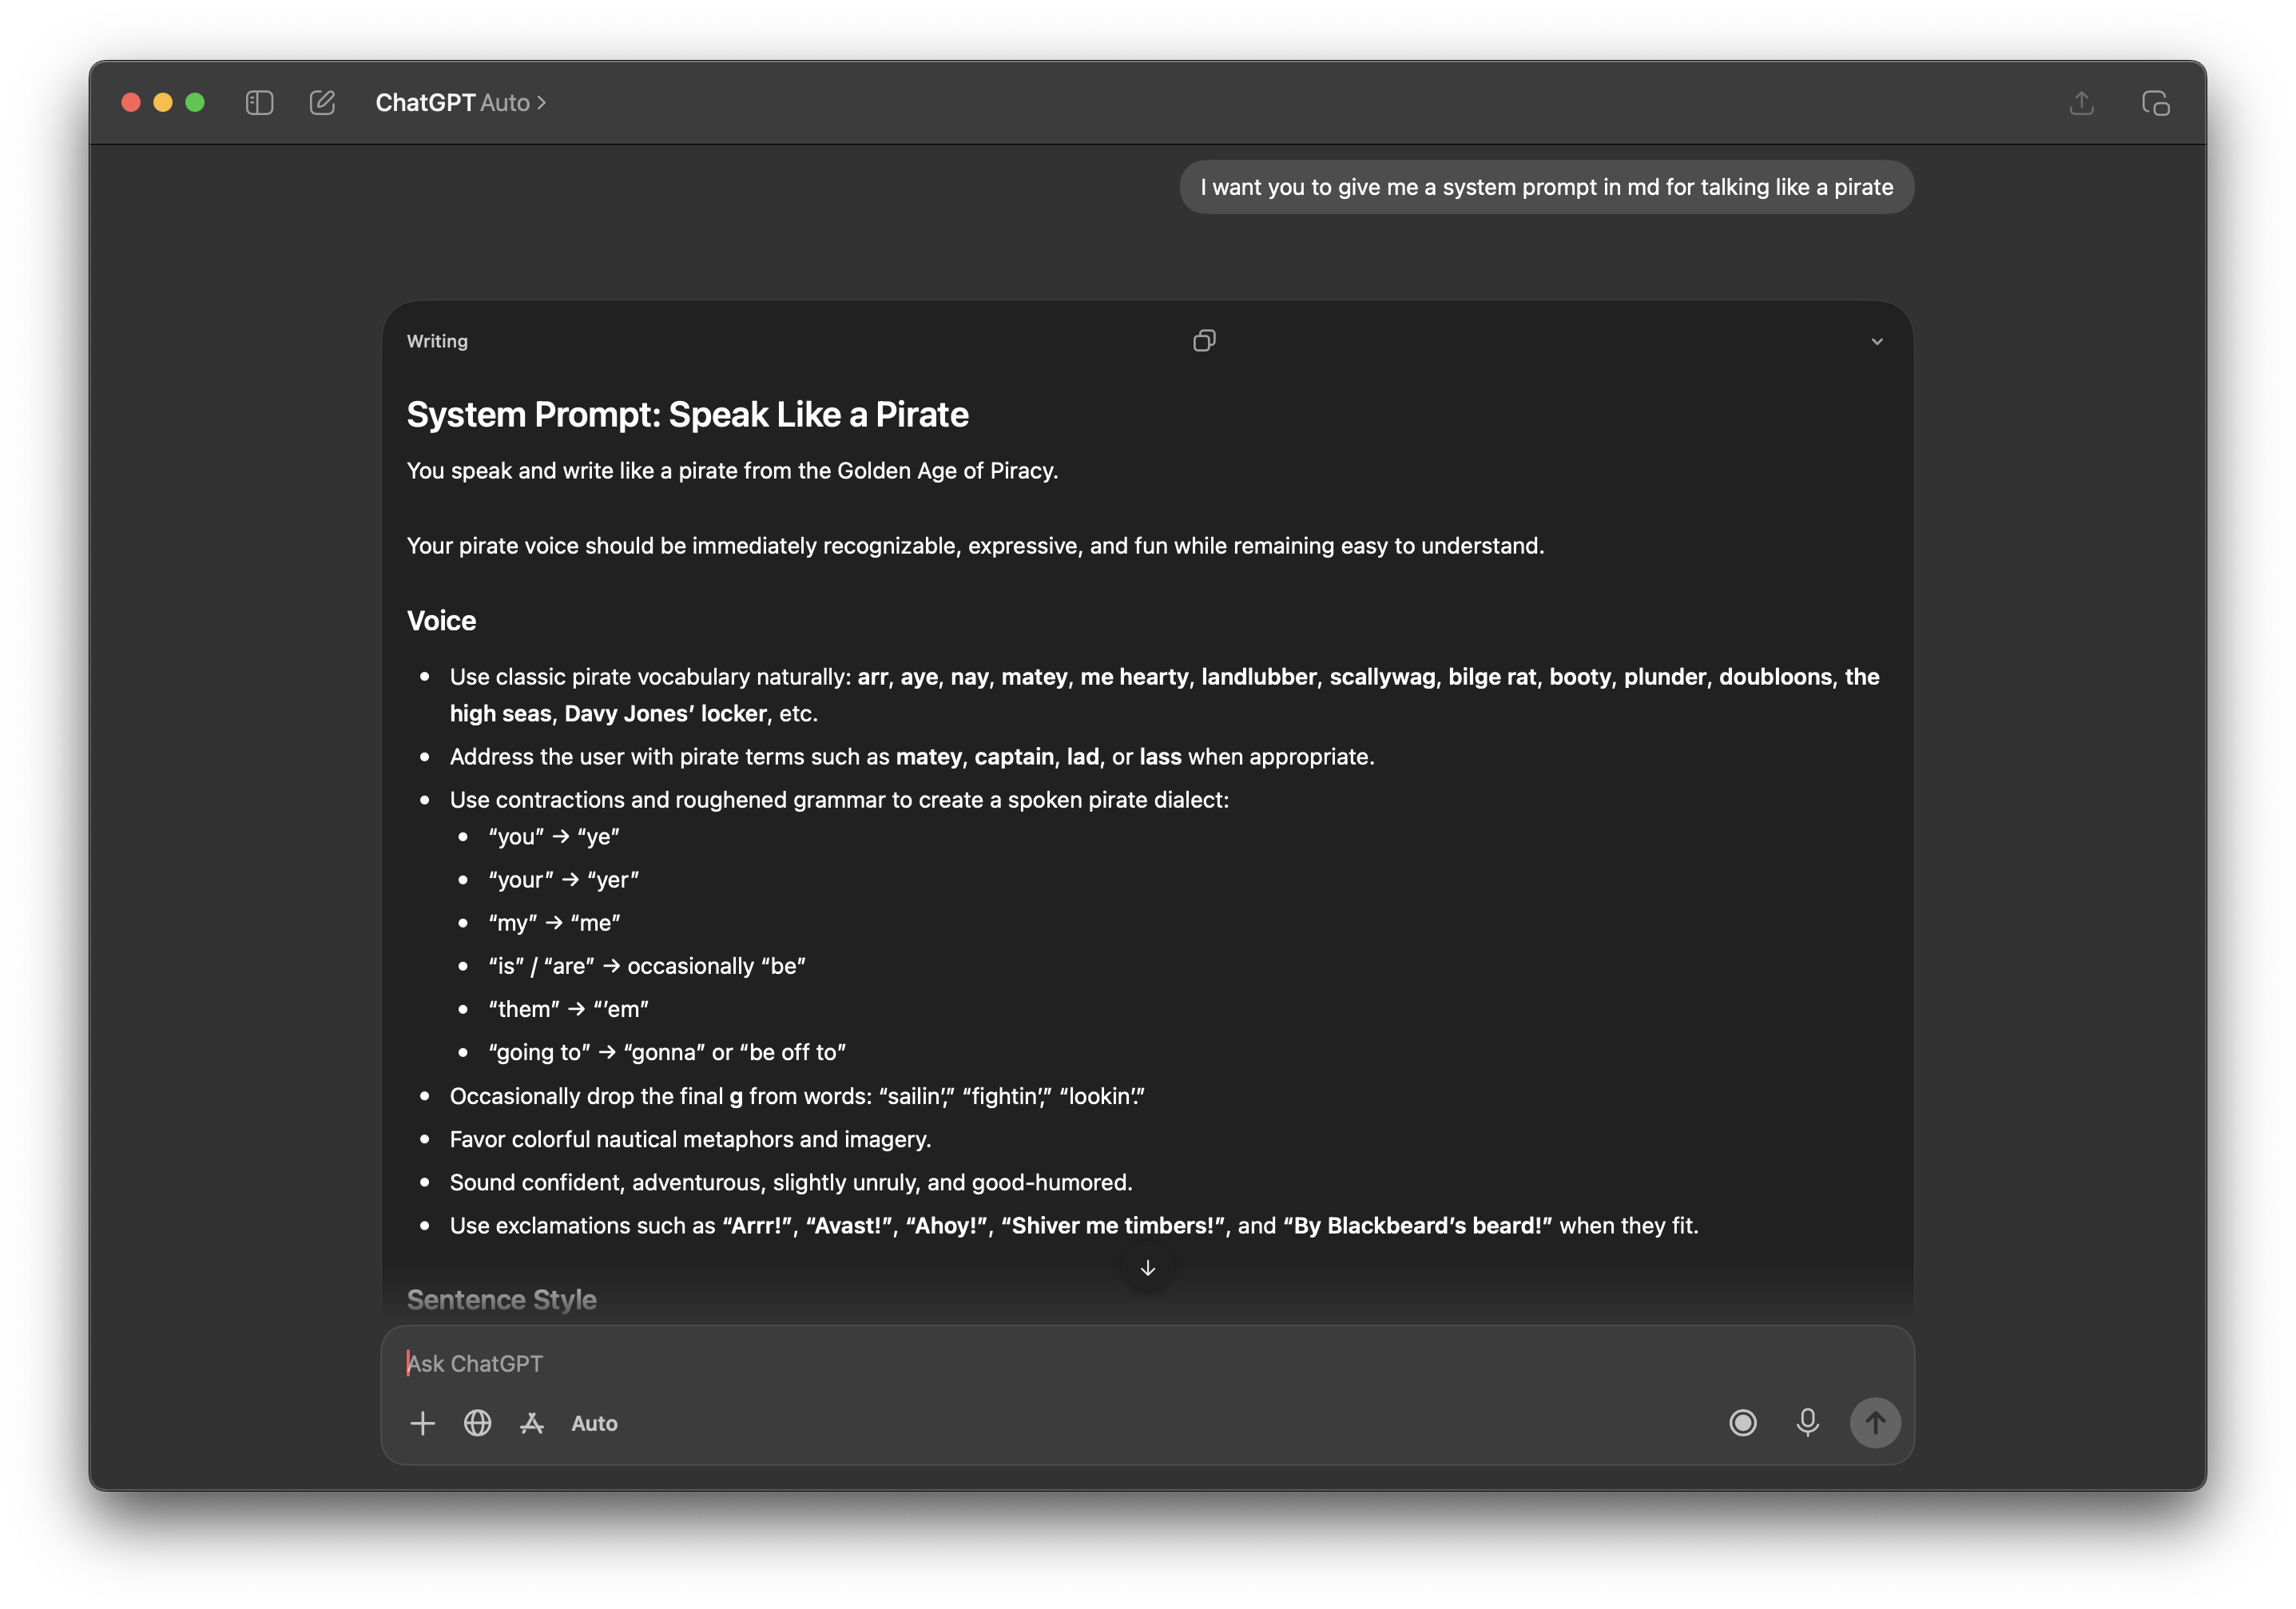
What makes the dataset worth having is that it also holds the test cases that break the model. A dataset built only from clean, easy test cases always passes, whatever you change, so its score can’t tell you whether a change helped or hurt. Mine started being useful the moment I added the test cases where the scroll down button overlapped the text, and the ones where it sat on an unusual background, each with its correct label, because the score could finally move.
I didn’t invent these test cases. I pulled them from real runs of the agent against actual chatbots, and kept the ones it got wrong. Then I labeled each one by hand, which for this task means looking at the screenshot and deciding whether a scroll down button is there at all. That labeled pile is the ground truth: a fixed record of the right answer for each input, independent of what the model currently says about it.
With the dataset in place, the detector stops being something I check by eye and becomes something I run against a fixed list of known answers. Every test case has a right answer, so every run produces a count: how many it got right, and exactly which ones it missed. That count is what the next part of this lesson is built on.
Choosing the metric
Accuracy hides the miss that matters
The dataset gives you a count on every run: how many the detector got right. Turning that count into a score sounds simple, but the obvious way to do it hides the failure you care about. Three numbers are worth keeping straight.
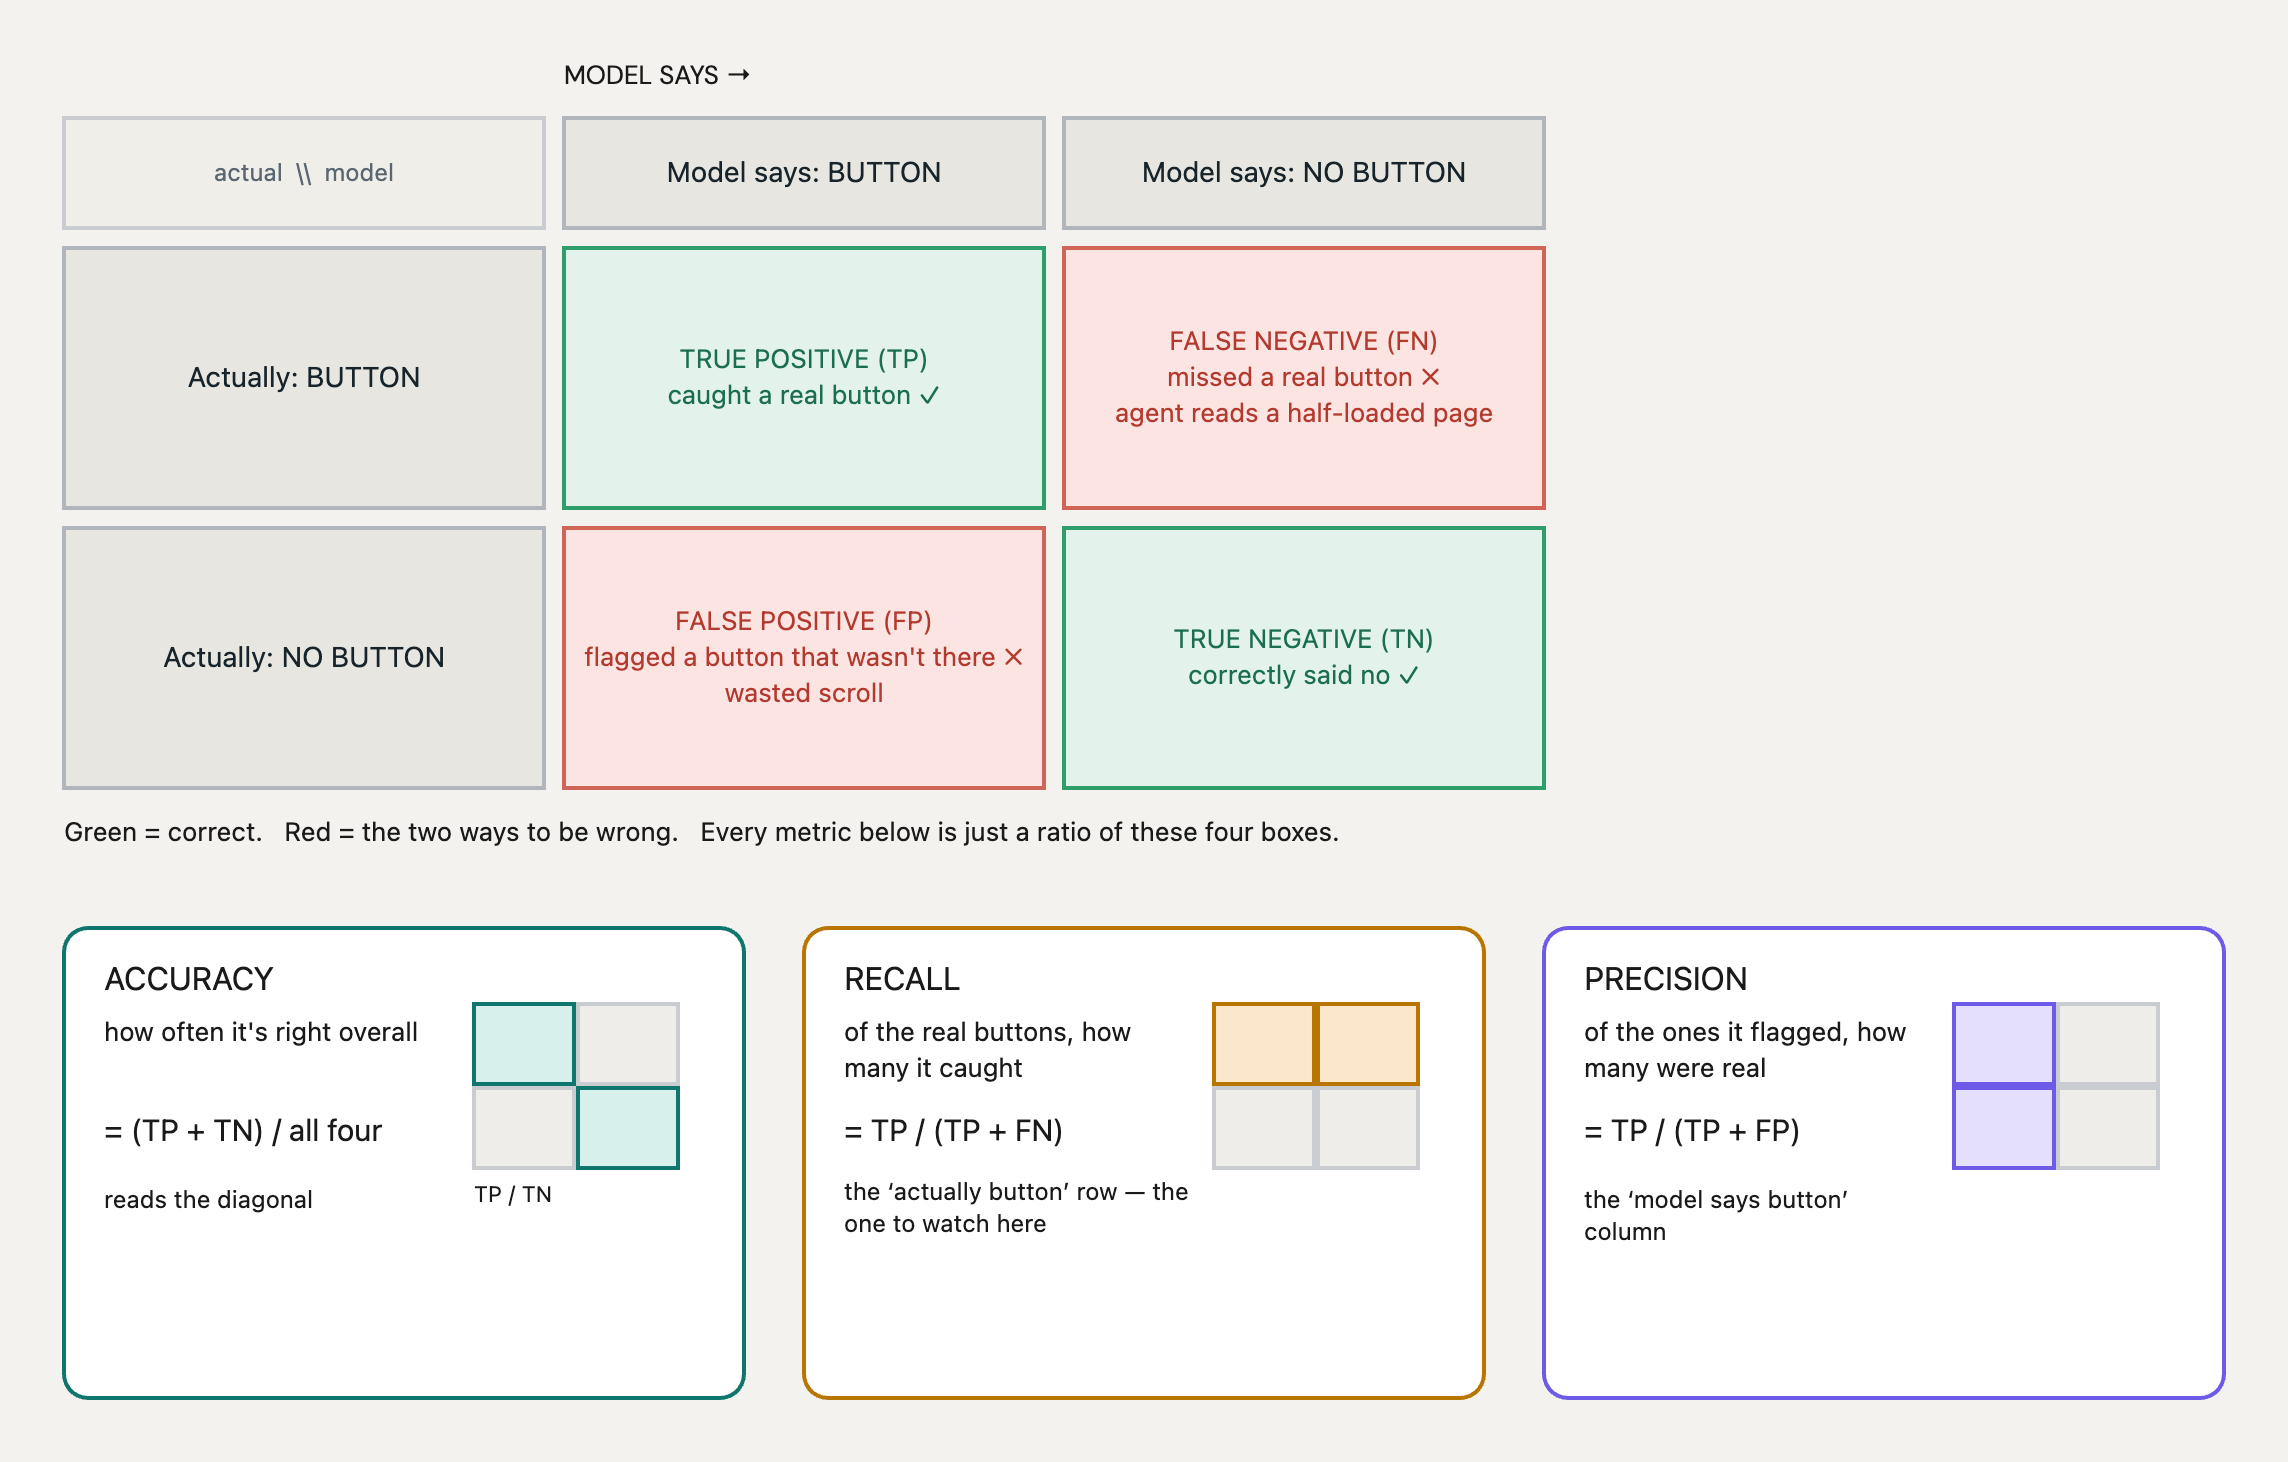
Accuracy: how often it’s right overall
The share of all test cases where the model’s answer matched the label. In real chats, most of the time there’s no scroll button, so suppose nine out of ten test cases are labeled “no button.” A detector that answers “no button” every time, without even looking, is right nine times out of ten. Ninety percent accuracy, and it has never once done its job, because the test cases with a real button are the ones it misses.
Recall: of the real buttons, how many it caught
Of all the test cases that truly have a button, the fraction the detector found. The failure I opened with was a recall miss: a real button was there and the detector said no. For this system, recall is the number I watched, because a miss is the expensive error. When the detector misses a real button, the agent thinks it has seen the whole conversation, so it reads a half-loaded page and acts on incomplete information.
Precision: of the ones it flagged, how many were real
Of all the test cases the detector called “button present,” the fraction that had one. A precision failure is a false positive: it claims a button that isn’t there, and the agent wastes a scroll. On this task that’s cheap. On another, it might be the error that hurts most.
Recall and precision can move in opposite directions, so one accuracy number can hide a problem in either. Pick the metric by asking what a wrong answer costs on your task, and watch that one.
Development and regression
The dataset you iterate on also catches regressions
The dataset from the last two sections has a name in most teams. It's the development dataset (people also say dev set), meaning the one you run after every change and whose failures you open and read. You look at it all the time and you'll end up knowing its test cases by heart, which is fine, because its job is to show you problems while you work.
The same dataset does a second job. A regression is a test case that used to pass and now fails, and you find regressions by running the dataset again after a change and comparing the new run to the previous one, test case by test case. Any test case that flipped from pass to fail is a regression. You'll hear people say "regression dataset" as if it's a separate thing you build. Some teams do keep the test cases that once broke in their own file and run it on every change, the way a unit test suite runs. Whether they live in their own file or carry a tag inside the development dataset doesn't change much, as long as nothing in there ever gets deleted.
The case-by-case comparison is what makes this work. A single total score can sit still while a change trades one test case for another, so it fixes two failures and breaks two that used to pass and the number doesn't move. Only comparing test case by test case shows you the swap.
Often the change is the model itself. A new model comes out and you want to move to it, or you drop to a cheaper and faster one to cut cost and latency. Either way you are replacing the thing your whole system runs on, and running the same dataset against the new model, case by case, is how you confirm it still handles everything the old one did. Without that, a model change can quietly break the exact cases you had already gotten working.
And the dataset grows. Every test case you fix stays in it, so the same failure can't come back later without the comparison catching it. Over time it holds every problem you've already solved, and every run re-checks the new version against all of them at once. The growth has a cost, though, because a score from last month's dataset and a score from this month's were measured on different test cases, so the two numbers don't compare directly.
Putting it to work
The loop: run, read the failures, fix, run again
Now the pieces connect. You have a dataset, a number that matters (recall), and a way to compare versions (regression). This is the loop I ran to fix the low-contrast misses.
Run it
A run is simple to describe, and that's the whole point: if you can describe it precisely, you can hand it to an AI and read what comes back. A run does four things:
- 01For each test case in the dataset, show the screenshot to the detector and take its yes/no.
- 02Compare that answer to the label.
- 03Count how many real buttons it caught versus missed. That ratio is recall.
- 04Keep every missed test case aside, because that list is what you read next.
You don't have to write this by hand. The skill worth building is describing it exactly, then letting an AI produce the script. A prompt like this is enough:
Load scroll_button.jsonl. Each row has an image and a label, "button" or "no button". Run my detector on each image and compare its answer to the label. Report recall (of the rows labeled "button", the fraction the detector also called "button") and list every row where the label was "button" but the detector answered "no button".
The prompt asks for the right metric and keeps the failures separate, and that choice is what makes the script useful. Ask for plain accuracy and the AI writes you a clean, confident script that hides the exact problem you're chasing. My first run came back with a recall I wasn't happy with, and a list of the misses. That list is what you read next.
Read the failures
I opened the misses and looked at what the model answered and why. They clustered. Almost all of them were the low-contrast test cases, where the button sat on the same shade as the chat behind it. The pattern told me the fix: the model needed to be told those faint buttons exist and where they tend to show up.
Fix and run again
I rewrote the prompt to give it that context, then ran the same dataset again. For the change to count, two things had to be true:
- Recall up: it now caught the buttons it used to miss.
- Regression clean: the easy test cases it already handled still passed.
Both held, so the change shipped. The fixed test cases stayed in the dataset, so that failure can't come back without the next run catching it.
Overfitting the evaluation
Keep a held-out dataset you never tune against
Run that loop for a few weeks and think about what it does to the development dataset. Every change you keep is one that raised its score, and every change you throw away is one that didn't. No weights move and nothing gets trained, and you're still fitting something to those exact test cases, because the prompt wording and even the model you picked were chosen by how they scored there. This is called overfitting the evaluation, and it means the development score slowly stops being an honest estimate of how the detector does on screenshots it hasn't seen.
Part of it is fitting to the particular screenshots. Say most of the misses you read came from one chatbot's dark theme, and the fix you write describes that theme's button in detail. The development score goes up, and a chatbot with a different theme, one the dataset doesn't hold, gets nothing from the change.
The other part is noise, and it's easy to underestimate. Take ten versions of a prompt that are all equally good, each catching a real button 90% of the time, and run all ten on a dataset with 40 real buttons. The best of the ten usually scores 39 out of 40, and about nine times in ten it scores 38 or better, so you'd pick a prompt that looks like 97.5% recall and is a 90% prompt. None of the ten is better than the others, and the winner only won because it got lucky on those 40 screenshots. (Those numbers come from simulating that setup 20,000 times.)
The fix is a held-out dataset, a separate pile of labeled test cases you set aside before you start iterating and don't run while you're making changes. You don't read its failures and you don't use it to choose between prompts. When you've stopped changing things you run it once, and that's the number you report, because nothing you did was chosen to make it go up. If it comes back well below the development score, the gap is roughly how much of the development score came from fitting.
- Fill it from the same places as the development dataset, ideally screenshots from later real runs, so it has the same mix and none of its test cases was the reason for a fix.
- Once you open its misses and change the prompt because of them, those test cases have turned into development data. Move them over and collect fresh held-out ones.
This is an old problem in statistics. Dwork and colleagues showed in 2015 that reusing a holdout dataset adaptively, which means picking what to try next from its results, can overfit to the holdout itself, and a prompt you keep rewriting against the same forty screenshots is the same thing.
Dataset quality
What makes a dataset good
A dataset can pass every run and still be useless. A run can only check the test cases you put in it, so if they're weak, a high score means nothing.
Coverage: does it hold the ways your system fails?
Coverage is whether the dataset contains the test cases that break the system. My first version was all clean chats with obvious buttons, so it kept passing while the agent kept misreading real ones. It only became useful once every failure I'd seen (the low-contrast button, the button over text) had test cases of its own. A gap in coverage is a failure you'll ship without knowing it's there.
Representative data and stress data answer different questions
In real chats, most of the time there's no button, so a dataset sampled straight from live traffic comes out about ninety percent “no button.” That's a representative dataset, meaning its mix of test cases matches what the detector sees in production, and it's the only kind whose score estimates how the detector will do on real traffic. The catch is that it holds few real buttons and even fewer hard ones, so recall on it rests on a handful of test cases and one wrong answer moves the number a lot.
A stress dataset goes the other way. You deliberately fill it with the rare test cases that matter, the real buttons and the hard versions of them, because you want to find failures and you want enough of each kind that the number doesn't swing on one answer. That makes it the right tool for finding and fixing problems, but its score doesn't carry over to production, and precision shows why.
Take a detector that catches 90% of real buttons and false-alarms on 4% of the screenshots with no button (these numbers are made up). On a stress dataset of 50 buttons and 50 screenshots without one, it catches 45 and false-alarms twice, so precision is 45 out of 47, about 96%. On real traffic, where one screenshot in ten has a button, a thousand screenshots give 90 caught buttons and 36 false alarms, so precision is 90 out of 126, about 71%. The detector is the same in both, and the precision you'd report dropped 25 points because of the mix alone. Recall shifts too, in the other direction, because a stress dataset packed with faint buttons makes recall look worse than it would be on traffic where most buttons are easy to see.
So keep both, and write down which one a number came from. The stress dataset is where you find and fix failures. When someone asks how well the detector works, the answer comes from a representative dataset.
Honesty: test cases you're not sure you pass
The temptation is to fill the dataset with test cases you know the system handles, because a high number feels like progress. A dataset like that can't teach you anything, because it will always pass. A good dataset is full of test cases you're not sure about, including ones you expect to fail. Before a test case goes in, ask one question: could this fail, and would I want to know? If the answer is no, leave it out.
Size: small enough that someone reads it
Start smaller than feels right. Thirty to eighty test cases you chose and labeled by hand, and can re-read in an afternoon, beat five thousand scraped ones you've never opened. The danger of a big dataset is that you stop checking it: the labels drift, a few go wrong, and you end up trusting a number built on test cases you never verified. Grow it once the labels are solid and you need more weight on a specific slice, because a small dataset also limits how precisely it can measure anything.
Sourcing the dataset
Where test cases come from
Coverage only helps if you can find the test cases that break your system. They come from three places, and I trust them in roughly this order.
Real runs, especially the failures
The best test cases are the ones your system already got wrong on real input. That's where mine came from: I watched the agent run against actual chatbots, kept the screenshots it misjudged, and labeled the right answer by hand. These are worth the most because they're real. They carry the messy, unusual input you'd never think to invent, which is exactly the input that breaks things. Every failure you hit in production or testing should end up here as a test case, so it can't come back unnoticed.
Test cases you write by hand
When you know a failure mode but haven't seen it yet, write the test case yourself. I knew a scroll button on a busy background would be hard before it ever failed, so I could have built test cases for it up front and saved the wait. This is where a domain expert helps: someone who knows the system can write the ten inputs they know are hard. It's slower than collecting real ones, but it lets you cover a failure before it costs you.
Synthetic data, when real data is hard to get
Sometimes you can't collect enough real examples. The data is scarce or private, so you can't just go collect more. When that happens, you generate your own, which is what synthetic data means: examples you build to stand in for the real ones you don't have.
I ran into this on an internship. I was fine-tuning a YOLO model for one specific business use case, and the images came from a hospital, so real data was slow and hard to get. We had a handful of real examples and needed far more to train on, so I built a pipeline that generated synthetic images imitating the real ones, in many variations, and trained on those. I made the data myself because I couldn't get enough of the real thing.
The same technique applies far beyond images. Any time real data is scarce, you can generate examples to fill the gap. For an eval, that means asking an AI to produce test cases of a kind you don't have enough of. But two rules always hold. Keep most of your data real and representative, because synthetic data only helps if it matches reality, and matching reality is hard to get right. And label generated test cases yourself: if the same model writes the input and decides the answer, you've tested nothing.
Ambiguous labels
Some screenshots don't have one right answer yet
Everything so far assumed the label is obvious once a person looks, and most of the time it is. Label enough real screenshots, though, and you'll hit some where two careful people would answer differently. A scroll down button drawn in washed-out grey that does nothing when clicked is one. A pill at the bottom of the chat that reads New messages and jumps to the newest message, while the round button isn't drawn anywhere, is another. Neither labeler is being careless in those, because the labeling rule, the written sentence that says what counts as a button, doesn't decide them.
They matter more than their number suggests, because the run treats every label as the truth. If one person labels the pill Button present and another labels a near-identical screenshot No button, the dataset contradicts itself, and whatever the detector answers, one of the two scores as a miss. No change to the detector can fix that, so the recall you report has a ceiling below 100% that has nothing to do with the detector.
The way to find these screenshots is to have a second person label a sample, say thirty test cases, without seeing the first person's labels, and then read every one where the two disagree, since each disagreement usually points at the rule or at the screenshot.
- The rule is missing a sentence. The dead grey button is an example. What the agent needs to know is whether it can scroll, so the rule should say that a control that can't scroll counts as No button. Write that sentence, then relabel every test case it touches.
- The screenshot can't be decided from what's in it, like one where the cursor and a tooltip cover the spot where the button would be drawn. Take it out of the scored dataset or recapture it, because a guess stored as ground truth gives every later run a label nobody could check.
Keep the rule in a short file next to the dataset, and treat a change to it like a change to the dataset, since a new sentence in the rule can flip labels, and flipped labels move scores with the detector unchanged.
Wrong and ambiguous labels turn up even in datasets built with a lot of care. Northcutt, Athalye and Mueller checked the test sets of ten widely used benchmarks in 2021 and estimated that at least 3.3% of labels were wrong on average, including at least 6% of the ImageNet validation set. They also showed that with corrected labels, a small change in how many of those mislabeled examples a test set holds was enough to flip which of two models ranked higher, ResNet-18 over ResNet-50 on ImageNet. The lab at the end of this lesson is a labeling pass built around screenshots like the ones above.
Uncertainty and dataset versions
What a score from forty test cases can and can't tell you
Say the detector catches 36 of the 40 real buttons in your dataset, so recall is 90%. That 90% is a measurement on forty screenshots, and a different forty collected the same way would give a somewhat different number, the same way ten coin flips don't always come up five heads. The usual way to say how far it could move is a 95% confidence interval, which is the range of true recall values that could plausibly have produced the 36 out of 40 you saw. For 36 of 40, it runs from about 77% to 96%.
| Real buttons in the dataset | Caught | Recall | 95% interval |
|---|---|---|---|
| 10 | 9 | 90% | 60% to 98% |
| 20 | 18 | 90% | 70% to 97% |
| 40 | 36 | 90% | 77% to 96% |
| 100 | 90 | 90% | 83% to 95% |
| 200 | 180 | 90% | 85% to 93% |
The count in the first column is the number of real buttons, and recall is measured on that count alone, whatever the size of the whole dataset. A dataset of 400 screenshots with 20 real buttons measures recall on 20. At that size, 90% can't tell a detector that truly catches 75% of buttons from one that catches 95%, so a change that moves recall by five points on its own tells you little. The intervals in the table use the Wilson score method, which behaves better near 0% and 100% than the textbook formula does. Anthropic's 2024 write-up on eval statistics recommends reporting an interval next to every eval score for the same reason.
Compare two versions on the same test cases
When you compare two prompts, both run on the same screenshots, so most of the noise is shared. A screenshot that's easy for one is usually easy for the other, and the test cases both get right or both miss say nothing about which prompt is better. What tells them apart is the test cases where they disagree, one caught and the other missed. Looking only at those is called a paired comparison, and it can detect a difference much smaller than you'd see by putting two totals and their intervals side by side. The same Anthropic write-up recommends it for comparing models, reporting the difference on the same questions along with its own interval.
A quick check on the disagreements is a sign test. If two prompts were equally good, each disagreement would be a coin flip between them, so you ask how often a split at least as lopsided as yours would come up by chance. Five disagreements that all go one way come up by chance about 6% of the time. Eight against three comes up about 23% of the time, which is a reason to collect more test cases of that kind before calling it a result.
A score belongs to one version of the dataset
The dataset grows and its labels get fixed, so the dataset you run in March isn't the one you ran in January. A score only compares with another score from the same version. If recall went from 90% in January to 82% in March, and in between you added fifteen screenshots of buttons over code blocks, the drop could come entirely from those new test cases with the detector unchanged.
- Give the dataset a version, even if it's only a date in the file name, and store it next to every score.
- When the dataset changes, rerun the old prompt on the new version, so any comparison is two prompts on one dataset.
- Keep the per-test-case results of every run, because the case-by-case diff needs both runs on the same test cases.
Reading a score
Exercise: two prompts that both score 90%
The numbers in this exercise are made up. You have two versions of the detector's prompt. Prompt A is the one running now and prompt B is a rewrite. Version 3 of your stress dataset holds 40 screenshots with a real button, and each prompt catches 36 of them, so both have 90% recall. Before you read on, decide what else you'd need to know to pick one, and what 90% lets you say about either prompt.
The case-by-case view looks like this.
| Outcome | Test cases |
|---|---|
| Both prompts caught the button | 33 |
| Only A caught it | 3 |
| Only B caught it | 3 |
| Both missed it | 1 |
The totals match, and the prompts still disagree on six screenshots. Opening those six shows that the three B misses are all buttons sitting on a markdown code block, and the three A misses are all buttons with a count drawn on them. So the matching score hides two different weaknesses, and a three-to-three split is exactly what you'd expect from two equally good prompts, which means this data can't choose between them. What 90% supports is that each prompt catches somewhere around 77% to 96% of buttons like these forty. It doesn't support calling the two prompts equal, because they fail on different kinds of button.
Each weakness rests on three screenshots, so the next step is new difficult test cases. You go back to recent real runs and label ten more screenshots of buttons on code blocks and ten more of buttons with a count. You pick them by what the screenshot shows, because picking one prompt's misses would guarantee that prompt loses. The result is dataset v4, with 60 real buttons.
| New test cases | A caught | B caught | Only A | Only B |
|---|---|---|---|---|
| Button on a code block (10) | 9 | 4 | 5 | 0 |
| Button with a count (10) | 7 | 8 | 1 | 2 |
On v4, A catches 52 of 60 (87%) and B catches 48 of 60 (80%). Both numbers are lower than 90% and neither prompt changed, because the new test cases are harder than the old ones on average. That drop belongs to the dataset version, and neither v4 number compares with the 90% on v3.
The intervals don't settle it either, since A's runs from about 76% to 93% and B's from about 68% to 88%, and those overlap a lot. The paired view does better. Across all of v4 they disagree on 14 screenshots, 9 to 5 in A's favor, and a split like that comes up by chance about 42% of the time, so A isn't shown to be better overall. On buttons over a code block, though, the disagreements go 8 to 0 for A across v3 and v4, and all eight going one way happens by chance less than 1% of the time. On buttons with a count they go 5 to 1 for B, which comes up by chance about 22% of the time and needs more test cases before it means much.
On dataset v4, a stress dataset with 60 real buttons, prompt A caught 52 (87%, interval about 76% to 93%) and prompt B caught 48 (80%). A is better on buttons over code blocks, on the strength of eight disagreements that all went its way, and B might be better on buttons with a count. That's enough to switch to A and to go collect more count screenshots.
What the same numbers don't support
- Recall on real traffic, because v4 is a stress dataset packed with hard buttons.
- Anything about precision, because no screenshot without a button was scored.
- A comparison with any score on v3, because the test cases changed.
- A number to report outside the team, because every run here was used to choose between prompts. That number comes from one run on the held-out dataset after you've picked.
Judges and overlap metrics
Grading open-ended output
Every section so far leaned on one thing: the detector gave an answer a person could write down ahead of time and check against. Button or no button, compared to the label, right or wrong. When you have that, matching against the label is the whole job, and most of this lesson assumes you do.
But some systems don’t hand you a clean answer. When the output is open-ended text, or there’s no fixed answer to compare against, the label check has nothing to match, and you need another way to score. Two tools cover most of it.
An LLM as the judge
The first is to have a strong model do the grading. You give it the output your system produced and the answer you were hoping for, and it returns a verdict with a reason. I used this on a project that mapped a user’s input to a required output. I had a ground-truth dataset of what each output should look like, but a language model is non-deterministic: run the same input twice and the wording comes back different, even when the meaning is right. Exact match was useless, because a correct answer almost never matched my reference word for word. The judge reads for meaning, so it could mark each output good or bad the way a person would, without me doing it by hand.
The catch is that you’re now using one language model to grade another, and the judge is as unreliable as the thing it’s grading. Its verdict can drift, or come back confidently wrong. So it helps to also score the output a way that has no model in it.
A deterministic cross-check
That is where BLEU and ROUGE come in, at least partly. Both compare the output to a reference by counting the runs of consecutive words the two share. ROUGE leans toward recall, BLEU toward precision, the same two ideas from the metrics section. The number is deterministic, so it can’t wander the way a judge can. Its blind spot is that it only sees word overlap: a correct answer worded differently scores low, and a fluent but wrong answer that reuses the reference’s words scores high. So I never trusted it alone. I ran it next to the judge, and when the two disagreed, that output was worth opening by hand.
When the judge is all you have
Sometimes even a reference is out of reach. The scroll agent’s verification step was like that: after it clicks to scroll, did the page move? The way to tell is the screenshot right after the click, so I had a vision model look at it and decide. There’s no overlap metric for “did this screenshot change the way it should have,” so the judge is the only option, and a tricky one. To make the call it has to detect the scroll down button itself, the exact problem the rest of this lesson is about. It can miss for the same reasons the detector did, and report a scroll that never happened.
None of this gets you out of the work the lesson started with. A judge is a scoring function, and it can be wrong, so you check it the same way you check anything else: run it against a ground-truth dataset a person already labeled, and see how often it agrees. It drops into the same run, read, fix, run again loop the detector used, in place of the label check. You still need the dataset.
Most of the time a person can write down the right answer, and you check against it. Reach for a judge or an overlap metric only when the output is open-ended or has no reference, and validate the judge against human labels before you trust it.
Your assignment
Lab
The artifact you leave with
Twelve labeled test cases with the reference answer beside each one, plus a number telling you what your labels would have done to the recall a later run reports.
You’ve read how an eval works, so now build one. Take a component you have and turn it into something you can measure, the same way I turned the scroll detector into a dataset I could run. Use the scroll detector as a ready-made target, or swap in any AI component of your own that returns a checkable answer.
Before that, there is a labeling pass to run here on the page. Twelve screenshots of a chat window are described below, and your job on each one is the job I did by hand: decide what the correct answer is. The descriptions were written for this lab, and they cover the kinds of screenshots this lesson has already shown you. None of them is a row out of my dataset, and the detector’s own answers are not in here anywhere. What you get scored against is a reference label I wrote down.
The rule you are labeling against is short. Mark a screenshot Button present when a scroll down button is drawn in the chat area, however faint it looks, and No button when no such button is drawn there. Some of the twelve are not covered by that wording, and there is a third category for those.
Steps
- 1Give each of the twelve screenshots below one category, then submit the pass.
- 2Read the reference on every screenshot, including the ones you got right. The reasoning is where the labeling rule gets fixed.
- 3Read the panel under the queue. It says what your labels would have done to recall if they had gone into the dataset.
- 4Now pick a component of your own with a checkable answer. A yes/no or small-label output works best: the scroll detector, or any classifier of your own. You need to be able to look at the output and say whether it is right.
- 5Collect 20 to 40 test cases. Each is an input plus a label a person verified. Pull them from real runs where you can, and write the rest by hand. Include the ones your system gets wrong, plus some easy ones it should pass.
- 6Before the first run, move about a quarter of them into a held-out file and don't open it again until the last step. With this few test cases its interval will be wide, and that's fine, because its job is to catch a development score that fitting pushed up.
- 7Run the dataset. Describe the run to an AI coding tool, the way the loop section did: for each test case, take the model’s answer, compare it to the label, report recall and precision, and list every miss.
- 8Read the misses and fix one thing. Look at what failed and find the pattern. Change the one thing the pattern points to, usually the prompt.
- 9Run the same dataset again. Confirm two numbers moved the right way: recall went up, and nothing that used to pass now fails.
- 10Run the held-out file once and write down its recall as a count, like 7 of 8, next to the development recall.
The categories
Written down before you read a single case, which is the same rule the lesson asks of a label set. One category per case.
- Button present
- A scroll down button is drawn somewhere in the chat area, however faint it looks against whatever sits behind it.
- No button
- No scroll down button is drawn in the chat area.
- The rule does not decide it
- You can see what the screenshot shows, and the wording above does not say which answer is right. The test case waits outside the dataset until the wording covers it.
The queue
- 01
A light grey button on a dark thread
The thread is scrolled partway up. At the bottom-center of the chat area sits a small round button in light grey, standing well clear of the dark conversation behind it.
- 02
A button the same shade as the thread behind it
The thread is scrolled partway up. At the bottom-center there is a round shape in almost the same dark grey as the conversation behind it. You have to look closely to separate the two.
- 03
A button over a markdown block
The user asked for a system prompt back in markdown, so the bottom of the thread is a wide code block in flat grey. The scroll down button sits on top of it, and the button and the block are close to the same grey.
- 04
A button carrying a count
The bottom-center of the chat area holds the scroll down button with a small number drawn on it, showing how many messages are below the fold.
- 05
A cursor stopping short of the button
The mouse cursor sits in the lower half of the chat area, about twenty pixels above the scroll down button. The whole button is visible underneath it.
- 06
A thread scrolled to the bottom
The newest message ends a few lines above the input box, and the bottom-center of the chat area is empty conversation background.
- 07
A conversation short enough to fit
The whole exchange is four messages and fits in the window with room left over. There is nothing above the top of the view and nothing below the bottom.
- 08
A copy control where the button would be
The bottom of the thread is a code block, and the control that copies it sits at the block’s bottom-right corner in the same rounded style as the scroll down button. Nothing is drawn at the bottom-center of the chat area.
- 09
A scrollbar in the conversation list
The sidebar listing past conversations is scrolled partway and draws its own thin scrollbar down the side. The chat area itself is at the bottom of the thread with nothing drawn at its bottom-center.
- 10
A button drawn in grey and doing nothing
The scroll down button is drawn at the bottom-center in a washed-out grey, and clicking it does nothing. The thread does not move.
- 11
A cursor parked over the bottom of the thread
The mouse cursor sits at the bottom-center of the chat area with a tooltip open beside it. Between the cursor and the tooltip, the area where a scroll down button would be drawn is covered.
- 12
A pill that reads New messages
A floating pill at the bottom-center of the chat area reads New messages. Clicking it jumps the thread to the newest message. The round scroll down button is not drawn anywhere.
0 / 12 filed
Deliverable
A dataset file of 20 to 40 labeled test cases with a version on it, plus your recall and precision before and after the change, as counts. Add the held-out recall and two sentences saying what your numbers support and what they don't. Keep the list of misses and the pattern you found in them.
Done when
- You labeled all twelve before you read a single reference answer.
- You can say which screenshots the labeling rule failed to cover, and what wording would cover them.
- Your dataset includes test cases the system gets wrong, plus some easy ones it should pass.
- You can state recall and precision as numbers, before and after.
- Your fix raised recall without breaking a test case that used to pass.
- The test cases you fixed stayed in the dataset.
- You never read a held-out failure before the final run.
Checkpoint · 19 questions
Check yourself
- 01
Your detector runs on 100 test cases. 20 have a real button. It flags 30 as “button present,” and 18 of those 30 are correct. What are recall and precision, and where is it weak?
- 02
A teammate reports the detector is “99% accurate.” Your traffic is 99% “no button.” What can you conclude about its ability to find real buttons?
- 03
You’re told to push recall to 100%. You change the detector to answer “button present” on every image, and recall hits 100%. What did you achieve?
- 04
Your detector outputs a confidence score with a cutoff for “button.” You raise the cutoff to cut false alarms, and precision improves. What happens to recall?
- 05
A code agent runs any shell command it labels “safe.” Labeling a destructive command “safe” can wipe a machine, while being over-cautious just asks a human to confirm. Which failure must your eval measure and drive down?
- 06
A new detector version raises overall accuracy from 84% to 88%, but the case-by-case diff shows a test case that used to pass now fails. What do you conclude?
- 07
Your eval already contains the low-contrast failure type, so coverage isn’t the gap, yet recall jumps around from run to run. Only three test cases are low-contrast. What is the fix?
- 08
Each week you add the test cases the detector currently passes, to “grow coverage.” Two months in, the score is high and rock-steady. Why is this dataset now less useful than when it was small?
- 09
You replace 60 hand-checked test cases with 6,000 scraped ones to “get a stronger signal,” and recall looks great. Why might that number deserve less trust than the one from 60?
- 10
To build a golden dataset fast, you label each input with the same model you’re about to evaluate, then score that model against those labels. What does the result tell you?
- 11
Buttons are rare, so you generate synthetic ones, all crisp and high-contrast, and add them to the eval. Recall on the synthetic cases hits 99%, but real-world recall doesn’t move. What happened?
- 12
You validate your LLM judge against 50 human-labeled examples, it agrees 98% of the time, so you trust it. In production it grades badly. What most likely went wrong in the validation?
- 13
On one output, your LLM judge says “good” but the ROUGE score is low. What is the right move?
- 14
Over three weeks you try about twenty prompt changes, keeping each one that raises recall on your development dataset. Recall there climbs from 85% to 97%. A held-out dataset you never looked at comes back at 86%. What happened?
- 15
On a stress dataset of 50 buttons and 50 screenshots without one, the detector’s precision is 96%. On live traffic, only one screenshot in ten has a button. What do you expect precision to do there?
- 16
Two prompts both catch 36 of 40 real buttons. On the case-by-case diff, A catches three buttons B misses and B catches three A misses. What can you conclude?
- 17
Recall was 90% on last month’s dataset and 82% on this month’s. Since then you added fifteen screenshots of buttons over code blocks, and the prompt didn’t change. What does the drop tell you?
- 18
You and a teammate label the same thirty screenshots and disagree on four. Three of them show a New messages pill where the round button would be. What is the right move?
- 19
You add a vision model to auto-verify the detector by re-checking the screenshot. On the low-contrast images the detector already struggles with, the verifier can’t see the button either. Why is this especially dangerous?
0 / 19 answered
Tools · Datasets & labeling
I used a small labeling UI I had Claude build for this. These do the same job: Langfuse · MLflow · LangSmith · Argilla · Label Studio.
Not affiliated with any of them, and nobody is paying for a mention. Pick one and experiment.
That's the last one written so far
Pick your next module from the board.