
The capability
What release engineering for an AI system is
Part 1 was about load, meaning what happens when a lot of people use the app at once. This part is about change. As you already know from M4, a lot of what decides how an AI feature behaves never goes through a deploy. Moving a prompt to a new version, switching to a newer model snapshot or rebuilding the retrieval index all change the answers your customers get, and none of them touch the container image. So release engineering for an AI system means being able to say exactly what's running right now, and being able to move to something new in stages and put the old version back if it goes wrong.
Now you might be asking, why isn't the commit hash enough to tell you what's running? Well, because what's running is a whole list of things, like the container image, the prompt version, the model id, the retrieval index, the feature flags and the tool schemas, and the commit hash only covers the first one. Putting something back has the same limit. A rollback only restores the parts you pinned and versioned, and anything you didn't stays where it is, which is how you can roll back and see nothing change at all.
That's why the rest of this part exists. You roll out in stages because moving everything at once leaves you nowhere to look when quality drops. You need kill switches because some changes can't be undone by reverting them. And you set SLOs and error budgets so your alerts fire on what customers feel, while machine-level noise stays on a dashboard.
If you've read Part 1, the running example picks up where it left off.
Where it shows up
This comes up anywhere an AI feature's behavior can change without a deploy.
- A prompt registry where a label moves from v13 to v14 and no image changes.
- A model id pinned in config, where switching to a newer snapshot is a one-line edit with the blast radius of a release.
- A retrieval index that gets rebuilt on a schedule, changing what the model reads without touching the model.
- A feature flag enabling a tool for 5% of traffic.
Each of those is a release, and treating only the container image as one is exactly the mistake the flower company made that week.
Where this starts
Nobody could say what was running at 10:02
This is the change half of Valentine's week, where the agent stayed up the whole time and the answers got worse.
On Tuesday morning someone shortened the refund-policy wording in the prompt, moving the production label in the prompt registry from version 13 to version 14. Nothing deployed, in the sense that no container image changed. By Wednesday afternoon, the online judge M9 built had dropped below its alert line, and complaints about wrong change cutoffs were piling up in the support queue.
The on-call engineer did the reasonable thing and rolled back the container image. It changed nothing, because the image had been the same since the previous Thursday. Twenty minutes later someone opened a trace and found the prompt version stamped on it, saw v14 on every turn since Tuesday at 10:03, and reverted the label. Answers were back to normal within a minute.
Those twenty minutes weren't wasted, because they forced the team to ask what exactly was running, and what putting it back even means.
The release bundle
A release is a bundle, and a rollback restores only what you pinned
If you think of what decides an AI feature's answers, the code is only one part of it, and most of the other parts can change without a deploy.
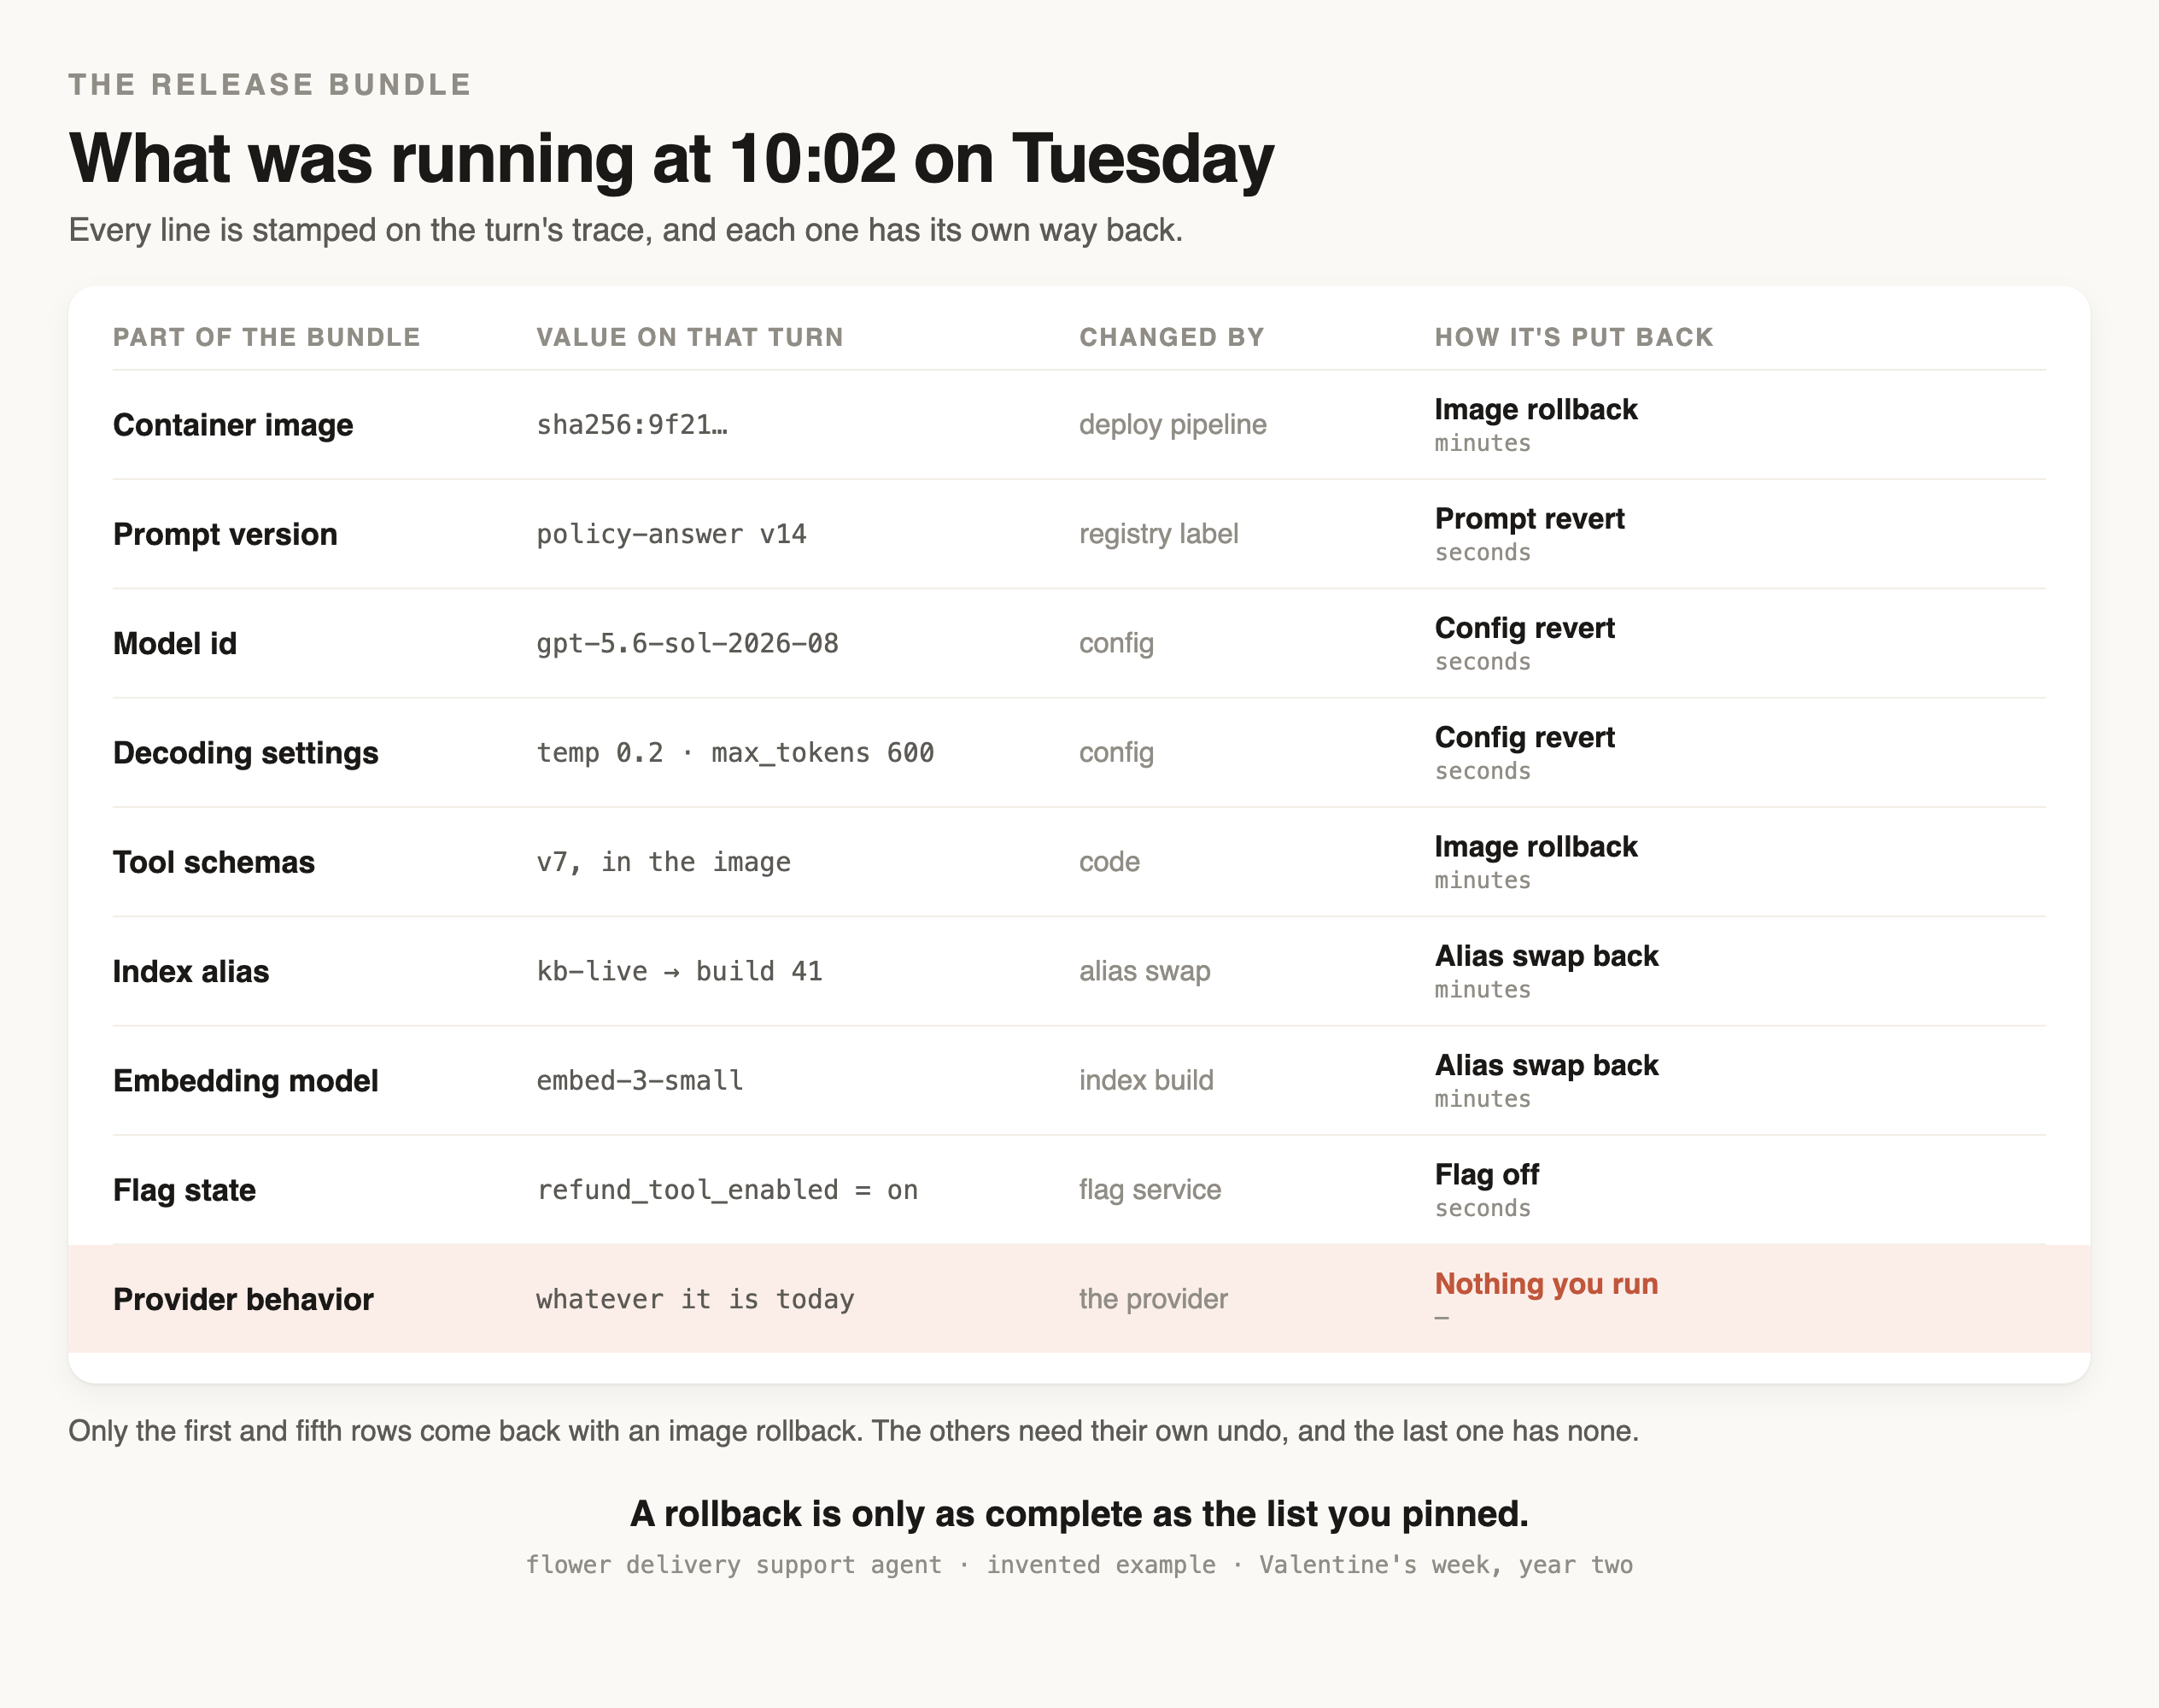
Kubernetes is clear about which part it handles. A Deployment's "rollout is triggered if and only if the Deployment's Pod template (that is, .spec.template) is changed," so a rollback restores the pod template and nothing else (Kubernetes). Everything else on that list lives outside the image and needs its own version history and its own undo.
You keep track of all of it in a release manifest, which records every part of the bundle for each release.
| Field | Example |
|---|---|
| Release id | 2026-02-10.3 |
| Image digest | sha256:9f21… |
| Prompt versions | policy-answer v13, refund-explainer v4 |
| Model id and settings | gpt-5.6-sol-2026-08, temperature 0.2, max_tokens 600 |
| Index alias and build | kb-live → build 41, embed-3-small |
| Flags changed | none |
| Eval result | 96% on the 200-question dataset, run against this bundle |
| Who approved it, and when | the on-call engineer, 2026-02-10 09:14 |
Closing that gap is easy. First, stamp the whole bundle on every request, so the trace for a turn carries every part of it, the way M2's traces already carry the model and its settings. That's what turned twenty minutes of guessing into one query. Second, treat a config change as a release. Whatever moves a prompt label or flips a flag should write an event saying who changed it and what the value was before, and that event goes on the same dashboard as deploys. A graph showing answers getting worse on Tuesday is hard to read until a line on it says what changed on Tuesday.
Rollout
Roll out in stages, and watch the signal that moves
The Tuesday prompt edit went to 100% of traffic at once, which is how prompt registries work by default. The team's release process for code was better, but it still had two gaps, and they're the ones that usually catch AI features out.
A staged rollout only helps if the signal arrives before the next stage
OpenAI's December 11, 2024 outage is the clearest published example. A new telemetry service configuration was "tested in a staging cluster, where no issues were observed," and the problem only appeared on clusters above a certain size. Then the rollout kept moving, because "our DNS cache on each node delayed visible failures long enough for the rollout to continue." By the time services started failing, the change was fleet-wide, and the Kubernetes control plane needed to fix it was the thing that was down (OpenAI, December 2024).
So for a smaller team, the takeaway is to leave each stage running for longer than the failure takes to show up. For a prompt change whose damage shows up in a judge's score on sampled answers, that's a matter of hours.
A canary needs a quality signal, and enough traffic to see one
M8 named the canary release as an evidence step, where a small share of traffic gets the new version first. The question is what the canary is watching. Error rate and latency stayed flat all Tuesday, so a canary watching those two numbers would have promoted the change.
Then there's volume. Suppose the failure hits 0.5% of turns, which is roughly what the shortened prompt did to answers about change cutoffs. The chance of seeing at least one bad turn in n turns is 1 − (1 − 0.005)ⁿ, so a 95% chance needs about 598 canary turns. What that costs in wall-clock time depends entirely on when you ship:
| Canary share | Traffic | Canary turns an hour | Time to 598 |
|---|---|---|---|
| 5% | Valentine's peak hour | 277 | 2.2 hours |
| 5% | A normal busy hour | 35 | 17 hours |
| 1% | A normal busy hour | 7 | 86 hours |
Seeing one bad turn is also weaker than knowing the rate went up, which needs the sample-size reasoning from M8 and considerably more traffic. So a 1% canary on a quiet Tuesday makes you feel better without telling you much. Either raise the share and hold the stage longer, or accept that the canary can only catch failures common enough to show up in the traffic you have.
Putting it back
Putting it back, and the changes you can't undo
When answers get worse, your first move is to get back to something you know works, and only then work out why. The options, from fastest to slowest:
| Lever | Speed | What it restores |
|---|---|---|
| Revert a prompt or config version | Seconds to a minute | The prompt or setting, everywhere at once |
| Flip a feature flag off | Seconds | One feature or tool path |
| Kill switch to a degraded mode | Seconds | A reduced reply or a handoff, for everyone |
| Roll back the image | Minutes | Code and anything baked into the image |
| Rebuild an index or swap its alias back | Minutes to hours | Retrieval behavior |
| Nothing | none | Refunds sent, emails delivered, memory written |
M9 introduced the kill switch as an operator's flag that sends conversations to a degraded mode or straight to a person. This part builds it. The first thing to get right is what the flag does when something breaks, because flags fall back to their default. The OpenFeature specification requires that "Flag evaluation calls must always return the default value in the event of abnormal execution" (OpenFeature). If refund_tool_enabled has a code default of true and the flag service goes down, the tool your team switched off during an incident comes back on by itself. Defaults belong on the safe side, and they're worth testing on the path where the flag service is unreachable.
You also have to test the off path. A degraded mode that nobody has read in six months says something embarrassing, links to a page that moved, or fails to hand off. Run it in staging on a schedule, and read what a customer gets.
Google's June 12, 2025 outage shows the cost of skipping the flag. A code change to Service Control "did not have appropriate error handling nor was it feature flag protected," and Google's own description of what flags would have done is the argument for them, since "Feature flags are used to gradually enable the feature region by region per project, starting with internal projects." A policy change replicated globally within seconds, the binaries crashed everywhere at once, and recovery in the largest region took "up to ~2h 40 mins" because the retry storm had no randomized backoff (Google Cloud, June 2025).
Some changes can't be undone at all. A refund that went out during the bad hour is gone, and so is an email that was delivered, and a memory the agent wrote is still sitting there. No rollback touches those, so the only control you have is on the way in, which is where M10's approval gates and M9's stop conditions sit.
Provider failure
When the provider fails, and when it fails quietly
On the 13th, the primary provider had an incident. The harness did what M9 built. It cooled down the primary and failed over to Sonnet 5, which had been carrying a steady 5% of conversations every day so the path stayed exercised. Within about a minute the fallback started returning 429s.
The fallback had been running fine every day, so why did it fail within a minute? Two things from Part 1 caught up with it. First, its traffic jumped twentyfold, from a 5% share to all of it in one minute, which is exactly the pattern providers throttle. Anthropic's documentation says to expect 429s "because of acceleration limits on the API if your organization has a sharp increase in usage," and asks customers to "ramp up your traffic gradually and maintain consistent usage patterns." Second, the secondary's cache was cold. Conversations that moved mid-way brought history the secondary had never seen, so all of it arrived as fresh input, which on the flower agent's workload is the difference between about 127k tokens a minute of uncached input and about 1.7M.
So when you design a failover, size the secondary's limits for the traffic you'd send it in a failure, and confirm the tier before the season starts. When the primary starts failing, move traffic across in steps, since providers throttle a gradual ramp less than a sudden switch. And decide what the degraded mode is for the gap, because for the first few minutes of a failover, policy answers plus a handoff may be all there is.
Quiet provider failures
A provider can also fail quietly, with no errors at all. Anthropic's September 2025 postmortem describes a load-balancing change that sent short-context requests to the wrong server type, where "At the worst impacted hour on August 31, 16% of Sonnet 4 requests were affected" and "Approximately 30% of Claude Code users who made requests during this period had at least one message routed to the wrong server type." The rate differed by platform, peaking at 0.18% on Bedrock and under 0.0004% on Vertex AI (Anthropic, September 2025).
So quality can drop with no error and no latency change, which is what M9's online judge is there to catch. The same model can also behave differently depending on which platform you reach it through, so the platform belongs in the bundle you stamp on requests. And since you can't roll back a provider, the only levers you have left are your own, the fallback and the kill switch.
SLOs and alerts
Set SLOs on what customers feel, and alert on how fast the budget burns
M9 defined the agent's reliability signals. An SLO takes one of those signals and sets a target for it over a time window, like 99.5% of turns ending well over the month. The error budget is the other 0.5%, the share you're allowed to get wrong.
The hardest line to agree on is what counts as a good turn. For the flower agent it's a turn that ends in an answer the checks passed, or in a clean handoff to a person, inside the 20-second deadline. Where you draw that line changes what your numbers say. A handoff counts as good, so the agent isn't punished for declining. A fallback answer counts as good, so failover doesn't spend budget. And an error that arrives after a 200, mid-stream, counts as bad, since the customer saw it.
It also helps to split the budget in two. The user-facing SLO counts every bad turn, whatever caused it, because the customer doesn't care whose fault it was. A second budget that counts only the failures your own changes caused is what you use to decide whether to freeze releases, since a provider outage shouldn't stop your team from shipping fixes.
Say the target is that 99.5% of turns end well over February. February carries about 288,000 turns, so the budget is about 1,440 bad turns for the month, and an average hour carries about 429 turns.
Alerting on "the ratio is above 0.5% right now" is useless, since a single bad minute crosses it. The SRE Workbook's answer is burn-rate alerting, where you page when the budget is being consumed fast enough to matter, using its Table 5-6 thresholds:
| Budget consumed | Window | Burn rate | Action |
|---|---|---|---|
| 2% | 1 hour | 14.4× | Page |
| 5% | 6 hours | 6× | Page |
| 10% | 3 days | 1× | Ticket |
A 14.4× burn on a 99.5% target means an error ratio of about 7.2% over an hour. Now put the same ratio in two different hours of February:
- In an average hour, 7.2% of 429 turns is about 31 bad turns, which is 2.1% of the month's budget. That's the number the table was designed around.
- In the Valentine's peak hour, 7.2% of 5,530 turns is about 398 bad turns, which is 27.6% of the month's budget, in one hour.
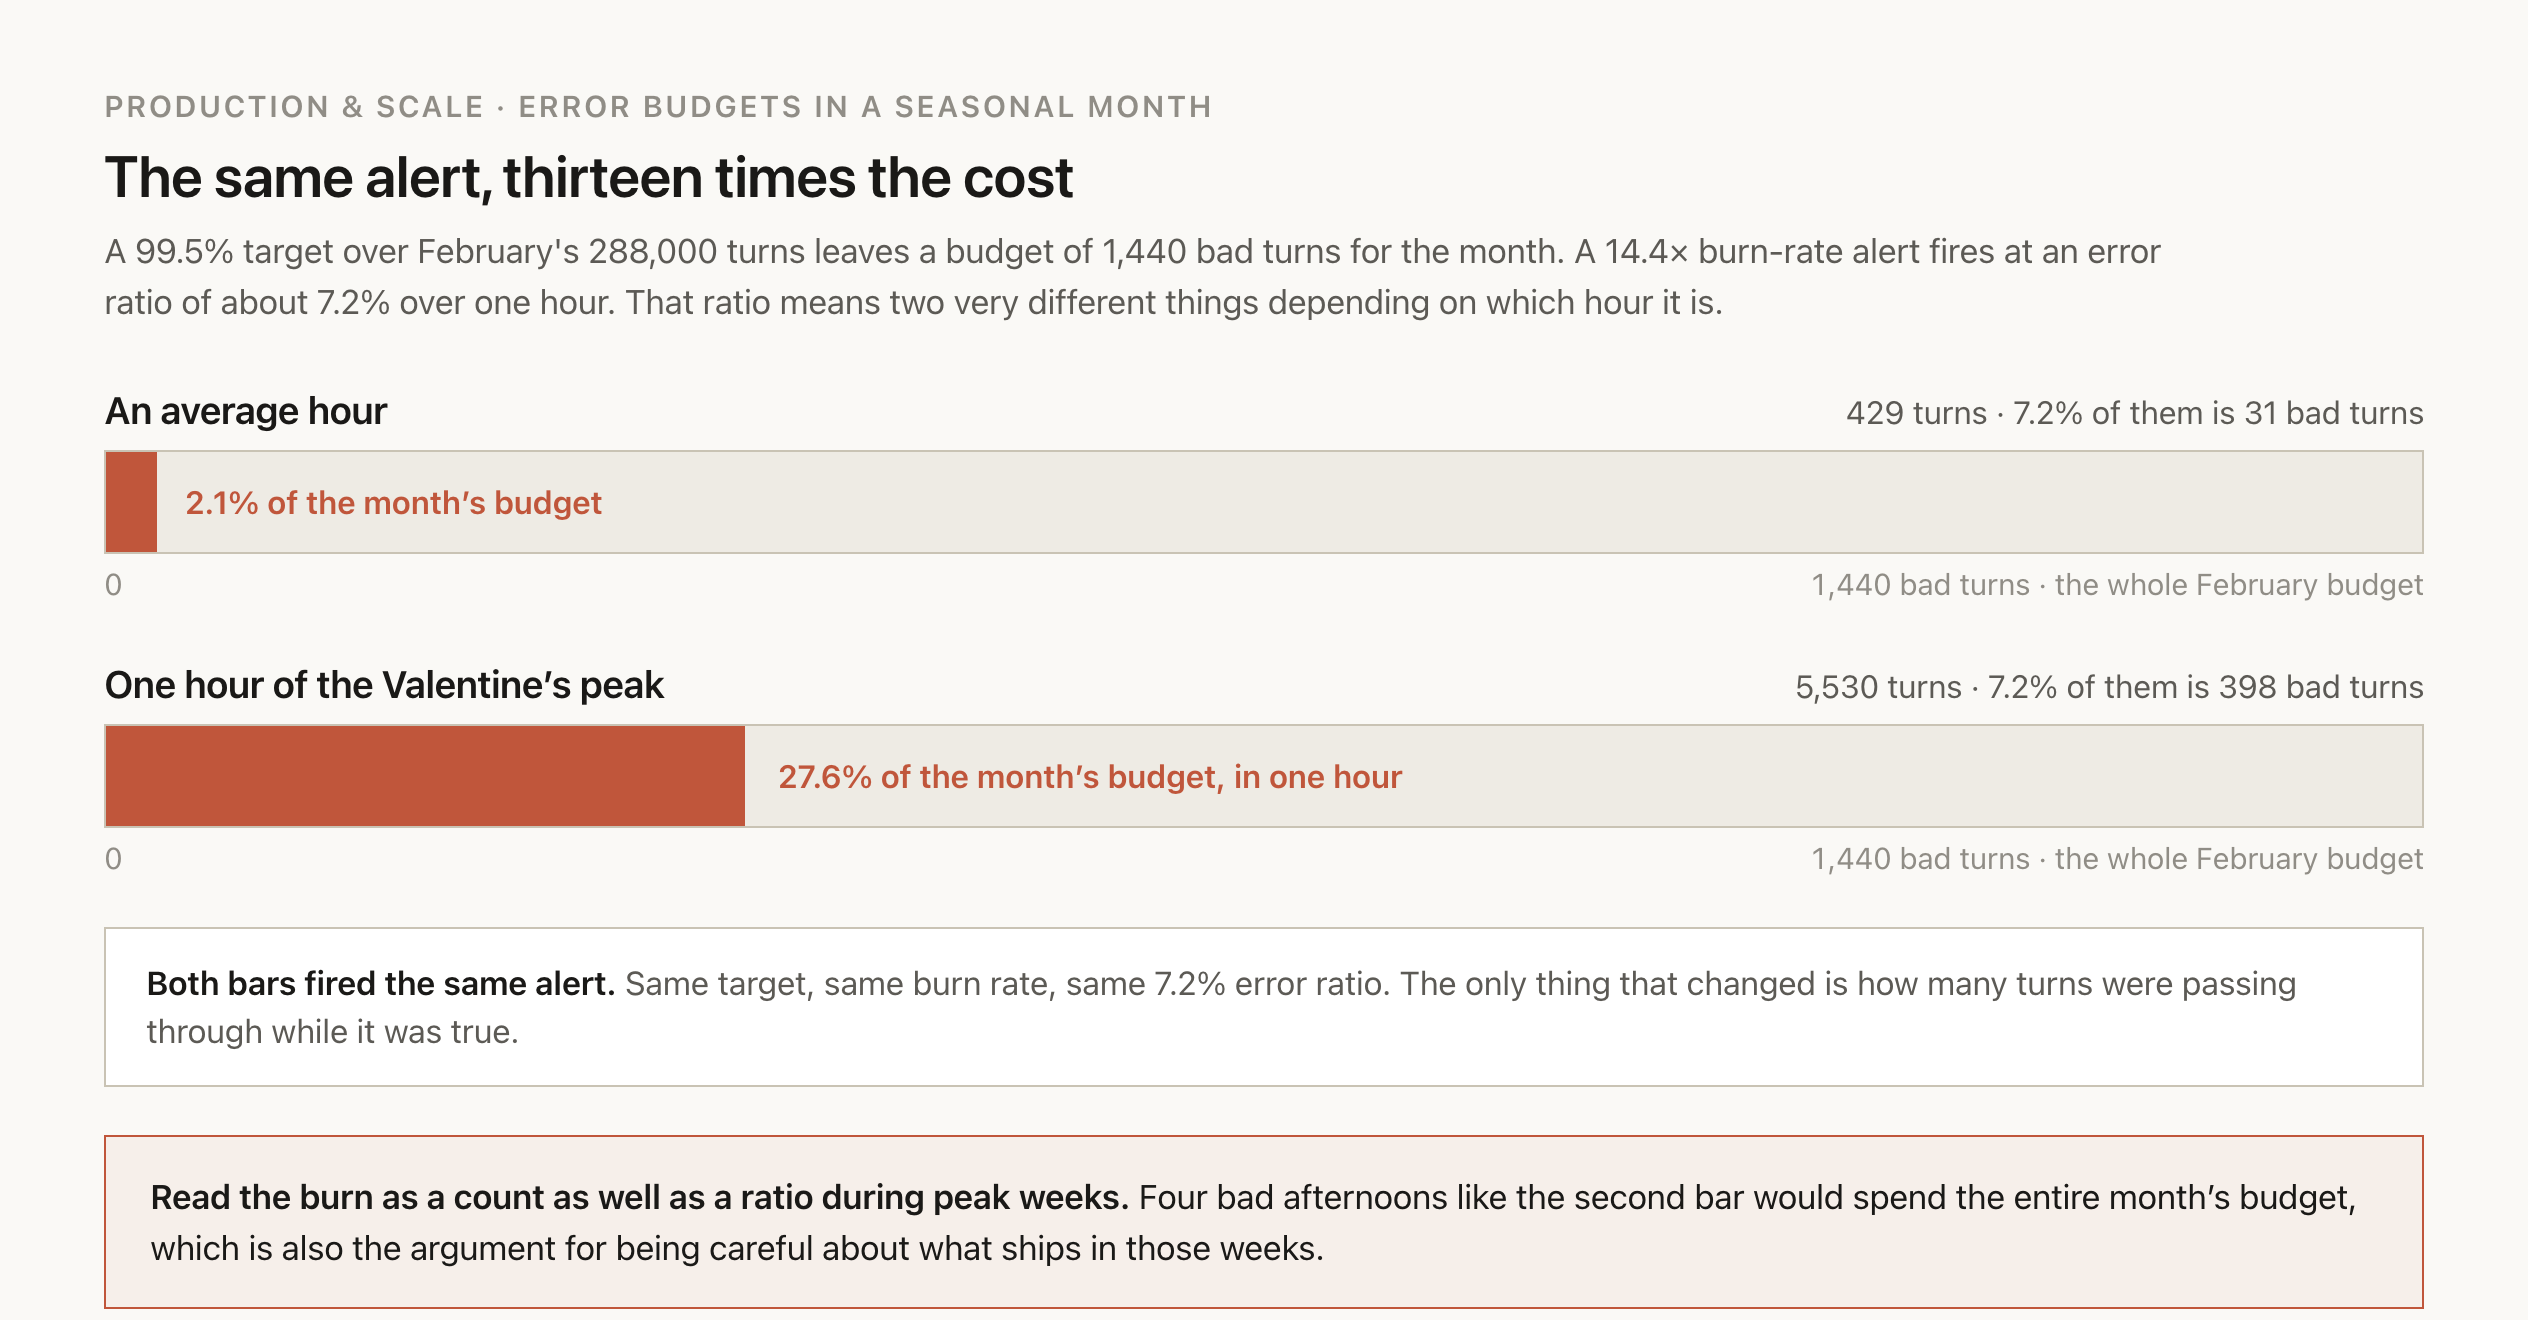
So the same alert on the same ratio can cost thirteen times more in one hour than in another. For a seasonal product, that means reading the burn as a count as well as a ratio during peak weeks, and being more careful about what ships then, since one bad afternoon can spend most of the month.
The other end of the range has the opposite problem. An internal tool at ten requests an hour can go a full day with a single failure and never trip a ratio alert, which is what golden-prompt probes are for, the known-answer requests M9 runs continuously against production.
Incidents
In an incident, stop the damage before you understand it
Valentine's week produced three incidents by most teams' definitions, and the pattern that separates a 20-minute incident from a two-hour one is the order of operations.
Declare early, and declare on a written trigger so nobody has to make the call under pressure. "The on-call had to intervene" works as a trigger, and so does "a burn-rate page fired twice". Declaring an incident costs you a Slack channel and a note, which is cheap enough that the bar should be low.
Assign the three roles straight away. Somebody runs the incident, somebody talks to the business, and somebody works on the system. On a small team one person can reasonably hold two of those, and nobody should ever hold all three.
Mitigate with the generic levers first. The table earlier in this part is the menu, and the order is always whatever restores service fastest. Finding the cause is the postmortem's job, and the customers waiting do not care which of the six parts of the bundle broke.
Write the timeline as you go, with every action timestamped in the channel. That becomes the evidence for the postmortem, and it is also the thing that tells you at 3 a.m. whether what you just tried helped.
Preserve the evidence before retention deletes it. M10's data rules give traces 30 days, and an incident sample copied somewhere durable will outlive the investigation that needs it.
Then postmortem the system and keep names out of it. What comes out should be a list of changes with owners on them, and the most valuable item is usually a signal that would have shown the problem sooner.
Incidents are also where deploy topology shows up as a data question. If the agent serves a regional endpoint for EU customers, the logs and traces from those turns follow the same rules as the data in them, so the tracing tool has to be regional too. M10 decides what may be stored and for how long, and M28 covers the obligations. The deploy's job is to keep the copies where the decision said they'd be.
Putting it together
Putting it together
Part 1 was about keeping the agent answering, and this part was about knowing what's answering and being able to put it back.
Most of it comes down to habits. Stamp the whole bundle on every request, so "what was running at 10:02" is a query. Give every part of the bundle its own rollout and its own undo, since the image is the only part kubectl knows about. And alert on how fast the error budget is burning, with a count next to the ratio when traffic is seasonal.
Before a feature like this goes into a peak week, it's worth going through a readiness review like this one, and most of it is facts the team should already have written down.
| Question | The answer to have |
|---|---|
| Request path per feature | Streamed chat, batch summaries, its own queue for the index sync |
| Peak capacity | 1.54 turns a second, about 27 turns in flight at a slowed provider, against 32 slots |
| Limits and tier | 1.7M tokens a minute at the peak, tier arranged in January, ramp rule understood |
| Overload behavior | Reject at the door with a 429, shed batch first, drop work past its deadline |
| Retries | One layer, in complete(), SDK retries off, budget capped at 10% |
| Release bundle | Image digest, prompt version, model id, decoding settings, index alias, flag state, all stamped on every request |
| Rollout | Canary with a quality signal in its analysis, soaked longer than the judge's detection time |
| Rollback | Prompt and flag reverts in seconds, image in minutes, one-way doors listed |
| Kill switch | Safe default, off path tested this quarter |
| Provider failure | Secondary at a steady 5%, its limits sized for full failover, degraded mode written |
| SLO and alerts | 99.5% of turns, burn-rate pages at 14.4× and 6×, count read alongside ratio in peak weeks |
| Incident process | Declare trigger, three roles, mitigation menu, evidence preserved |
M12 takes the same system and asks what it costs, which is where the tier and the model choice turn back into money. M9's harness sits underneath all of it, deciding what happens to each failed call.
Checkpoint · recall · 5 questions
What the module said
- 01
What does
kubectl rollout undorestore? - 02
Why did rolling back the container image do nothing on Wednesday?
- 03
A failure affects 0.5% of turns. Roughly how many canary turns give a 95% chance of seeing at least one?
- 04
In OpenFeature's specification, what does a flag evaluation return when the flag service is unreachable?
- 05
In the SRE Workbook's burn-rate table, what does a 14.4× burn over one hour mean?
0 / 5 answered
Checkpoint · understanding · 5 questions
Reason it through
- 01
Your fallback provider carries 5% of traffic every day. The primary fails and you move 100% to it in one minute. What breaks first?
- 02
Errors and latency are flat, the judge's score on sampled answers has dropped four points, and no deploy went out. What do you look at first?
- 03
A team proposes alerting when the error ratio goes above the SLO target of 0.5%. Why is that a poor alert?
- 04
Your product has a seasonal peak where one hour carries thirteen times the traffic of an average hour. What does that do to your error budget?
- 05
Why should a canary for a prompt change soak longer than one for a code change?
0 / 5 answered
Checkpoint · debugging · 4 questions
Debug it
- 01
During an incident, an engineer switched off the refund tool with a feature flag. Twenty minutes later refunds are going out again, and nobody re-enabled it. What happened?
- 02
A 1% canary ran clean for 30 minutes on a quiet Tuesday, so the change was promoted. Complaints arrived the next day. What was wrong with the canary?
- 03
The primary provider fails, traffic moves to the secondary, and the secondary returns 429s within a minute. Its dashboard shows token usage well under the limit. What's going on?
- 04
A burn-rate page fires twice during the Valentine's peak hour. The month-to-date error ratio still looks fine on the dashboard. What do you do?
0 / 4 answered
Go deeper
OpenAI: API, ChatGPT and Sora facing issues (December 11, 2024 postmortem) · Anthropic: A postmortem of three recent issues (September 2025) · Google Cloud: Service health incident, June 12 2025 · Google SRE Workbook: Alerting on SLOs · Kubernetes: Deployments
That's the last one written so far
Pick your next module from the board.