The capability
What is observability and traceability?
Observability is how much you can learn about what a running system did from the data it recorded while it ran. A system with good observability lets you answer a new question about last Tuesday’s failed run by reading what it recorded, with no new code and no need to run it again. Traceability is the part of that which follows one request through every step it touched, so you can go from a wrong answer at the end back to the step that produced it and the exact input that step received.
An AI system needs both more than most software, because when a model gets something wrong, the usual signals don't change. A web server that breaks throws an error or times out, and a dashboard shows it. A model that breaks returns a well-formed wrong answer with a success status and a normal response time, so error rates and uptime charts look fine. The same input can also give a different answer on the next run, so running it again won't always reproduce the bug. What you have left is the record of the run itself, and the rest of this module builds that record and shows how to read it.
It starts from one failure, my scroll down button detector missing buttons, and builds up to tracing a full multi-step agent.
Where this starts
Knowing what failed while the why stays hidden
By the end of the last module I could tell you exactly when my scroll down button detector was wrong. The dataset gave me a recall number and the exact screenshots it missed. What it could not give me was any reason for those misses. A test case shows that the model answered “no button” when a button was there, and that's all it shows. For a component that reads an image and returns yes or no, the output throws away everything that happened between the image going in and the answer coming out.
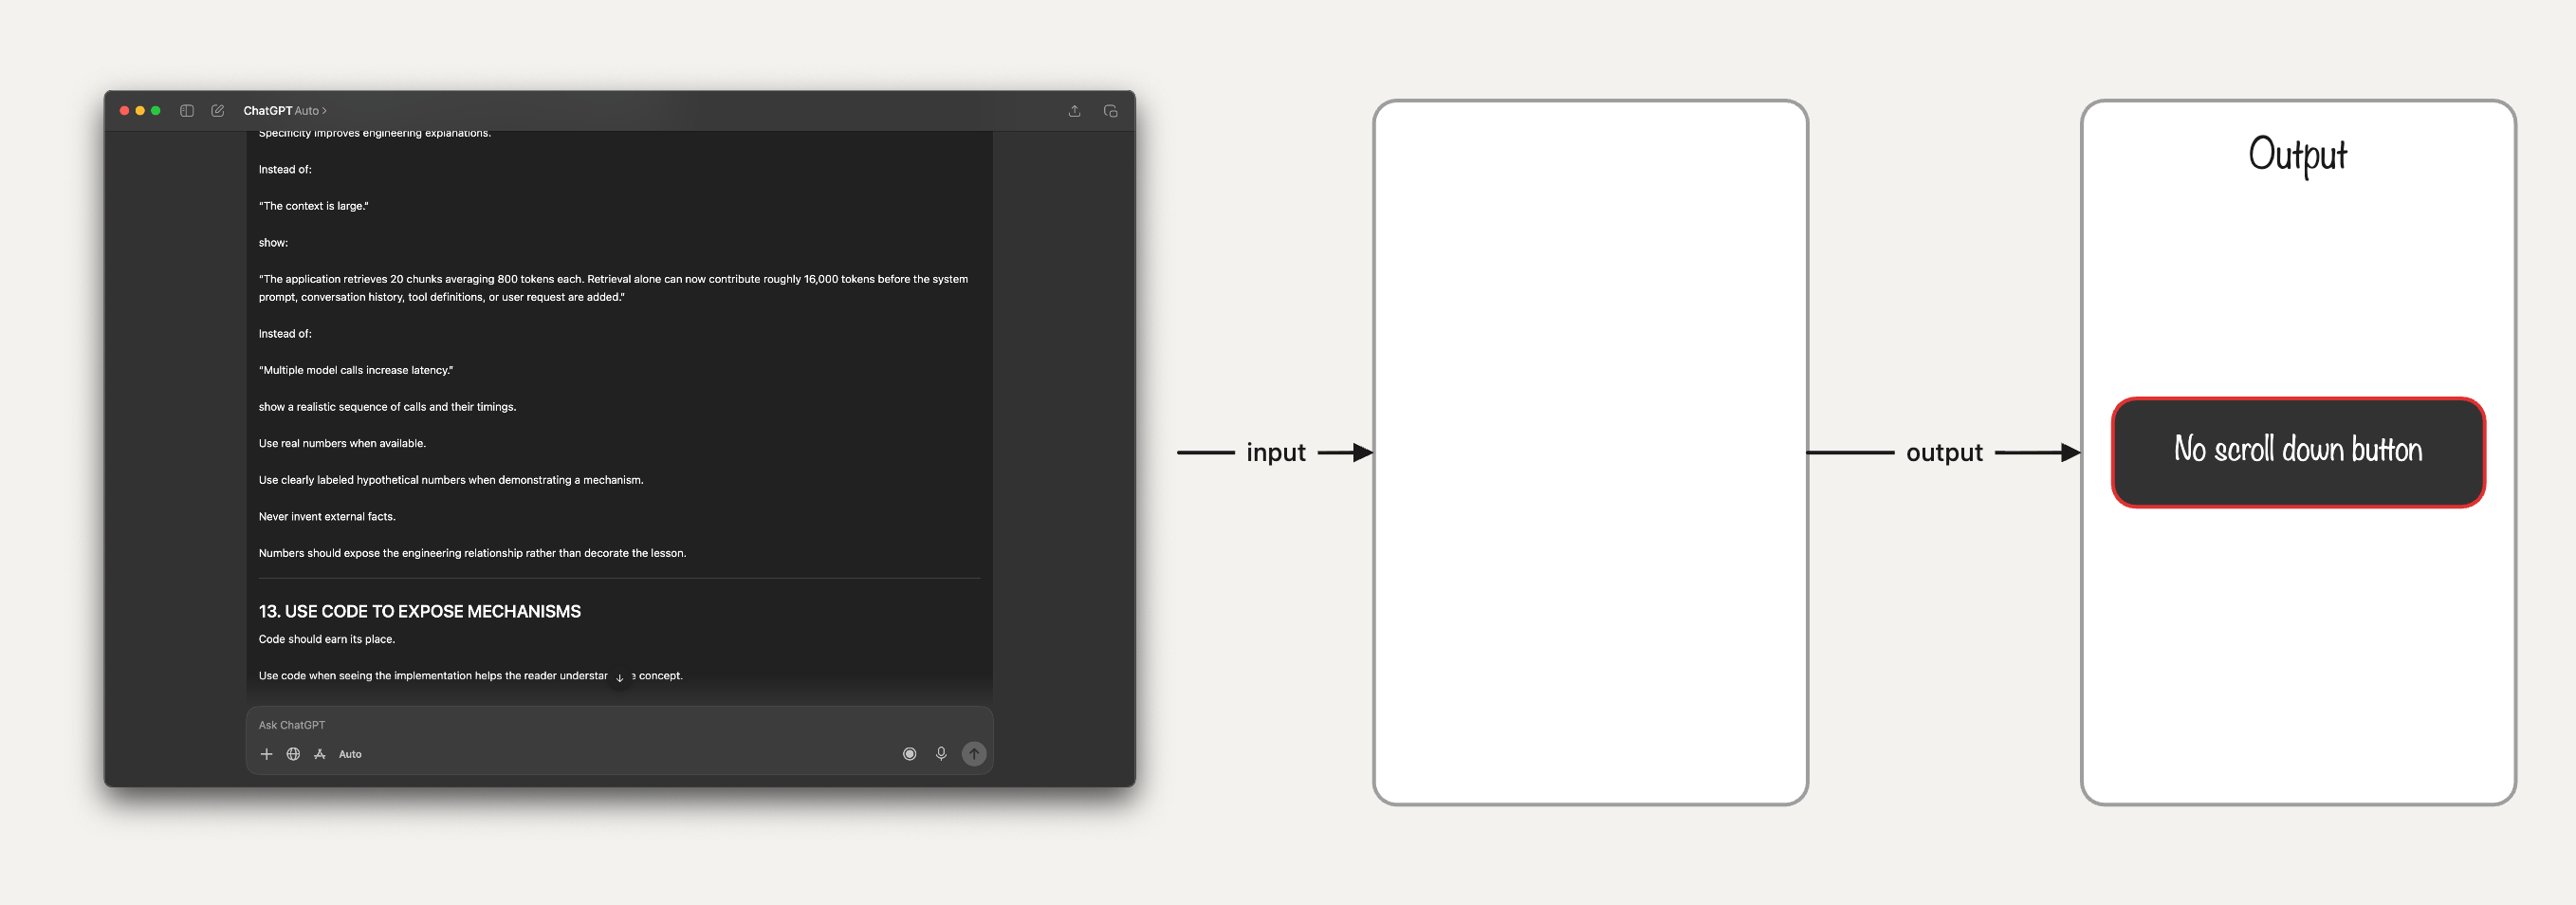
So I recorded it. I traced the detector’s runs through Langfuse and read back what the model reasoned on each screenshot it missed, which turned a list of wrong answers into a list of leads.
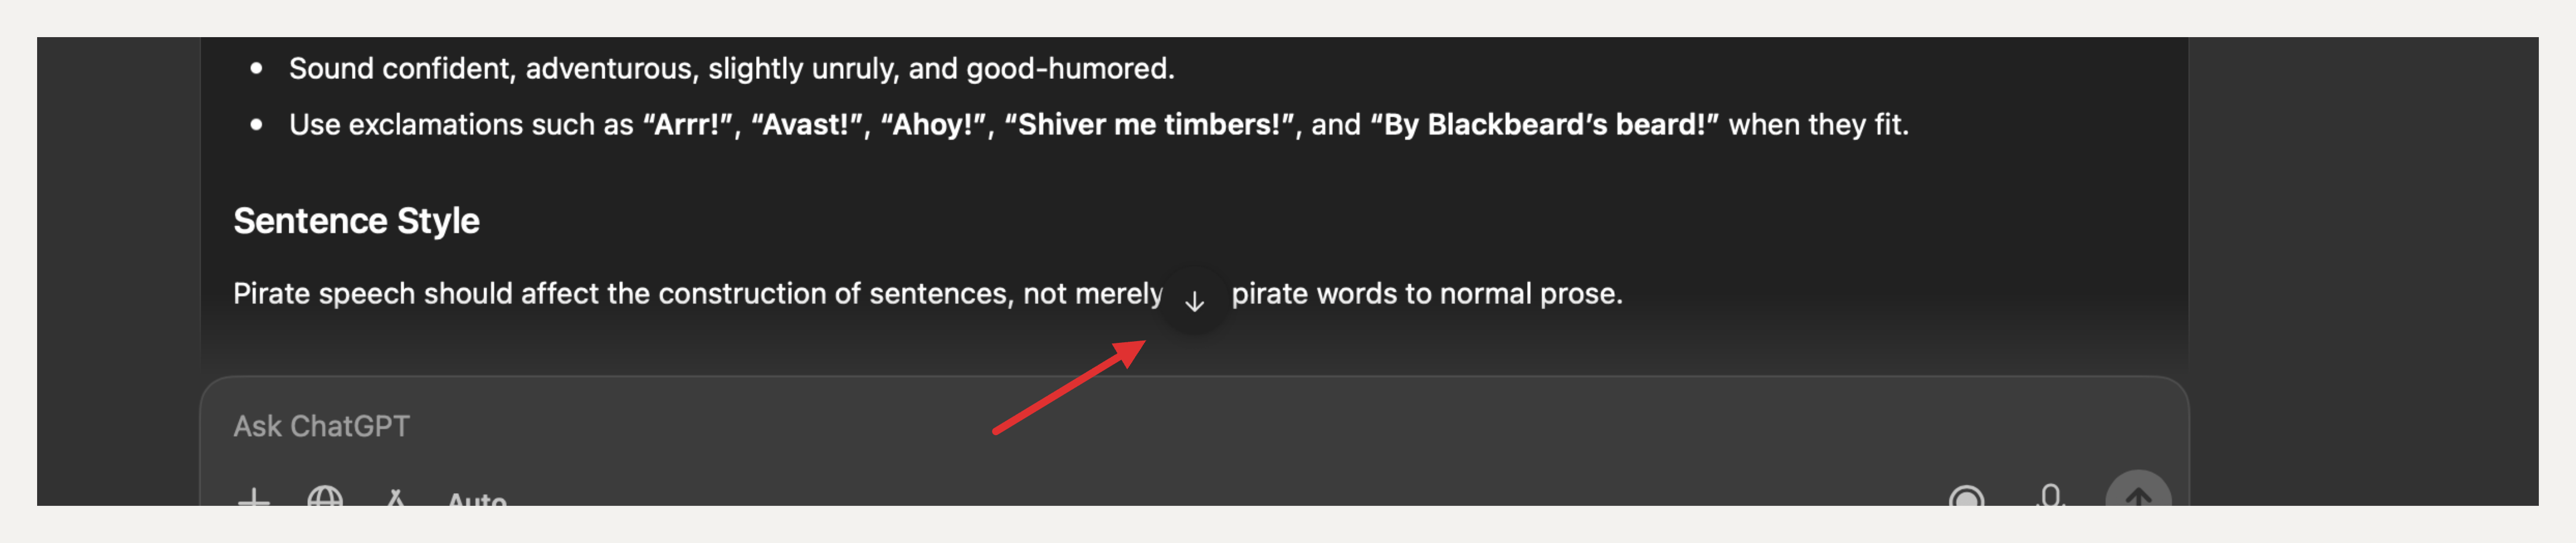
On the misses, the reasoning the model wrote never considered that the scroll down button could blend into the background. When a user asked for markdown output, the button sat on almost the same shade as the text behind it, and the reasoning read as though every button stands out, so it never described looking for a faint one. A yes/no answer would never have pointed me there.
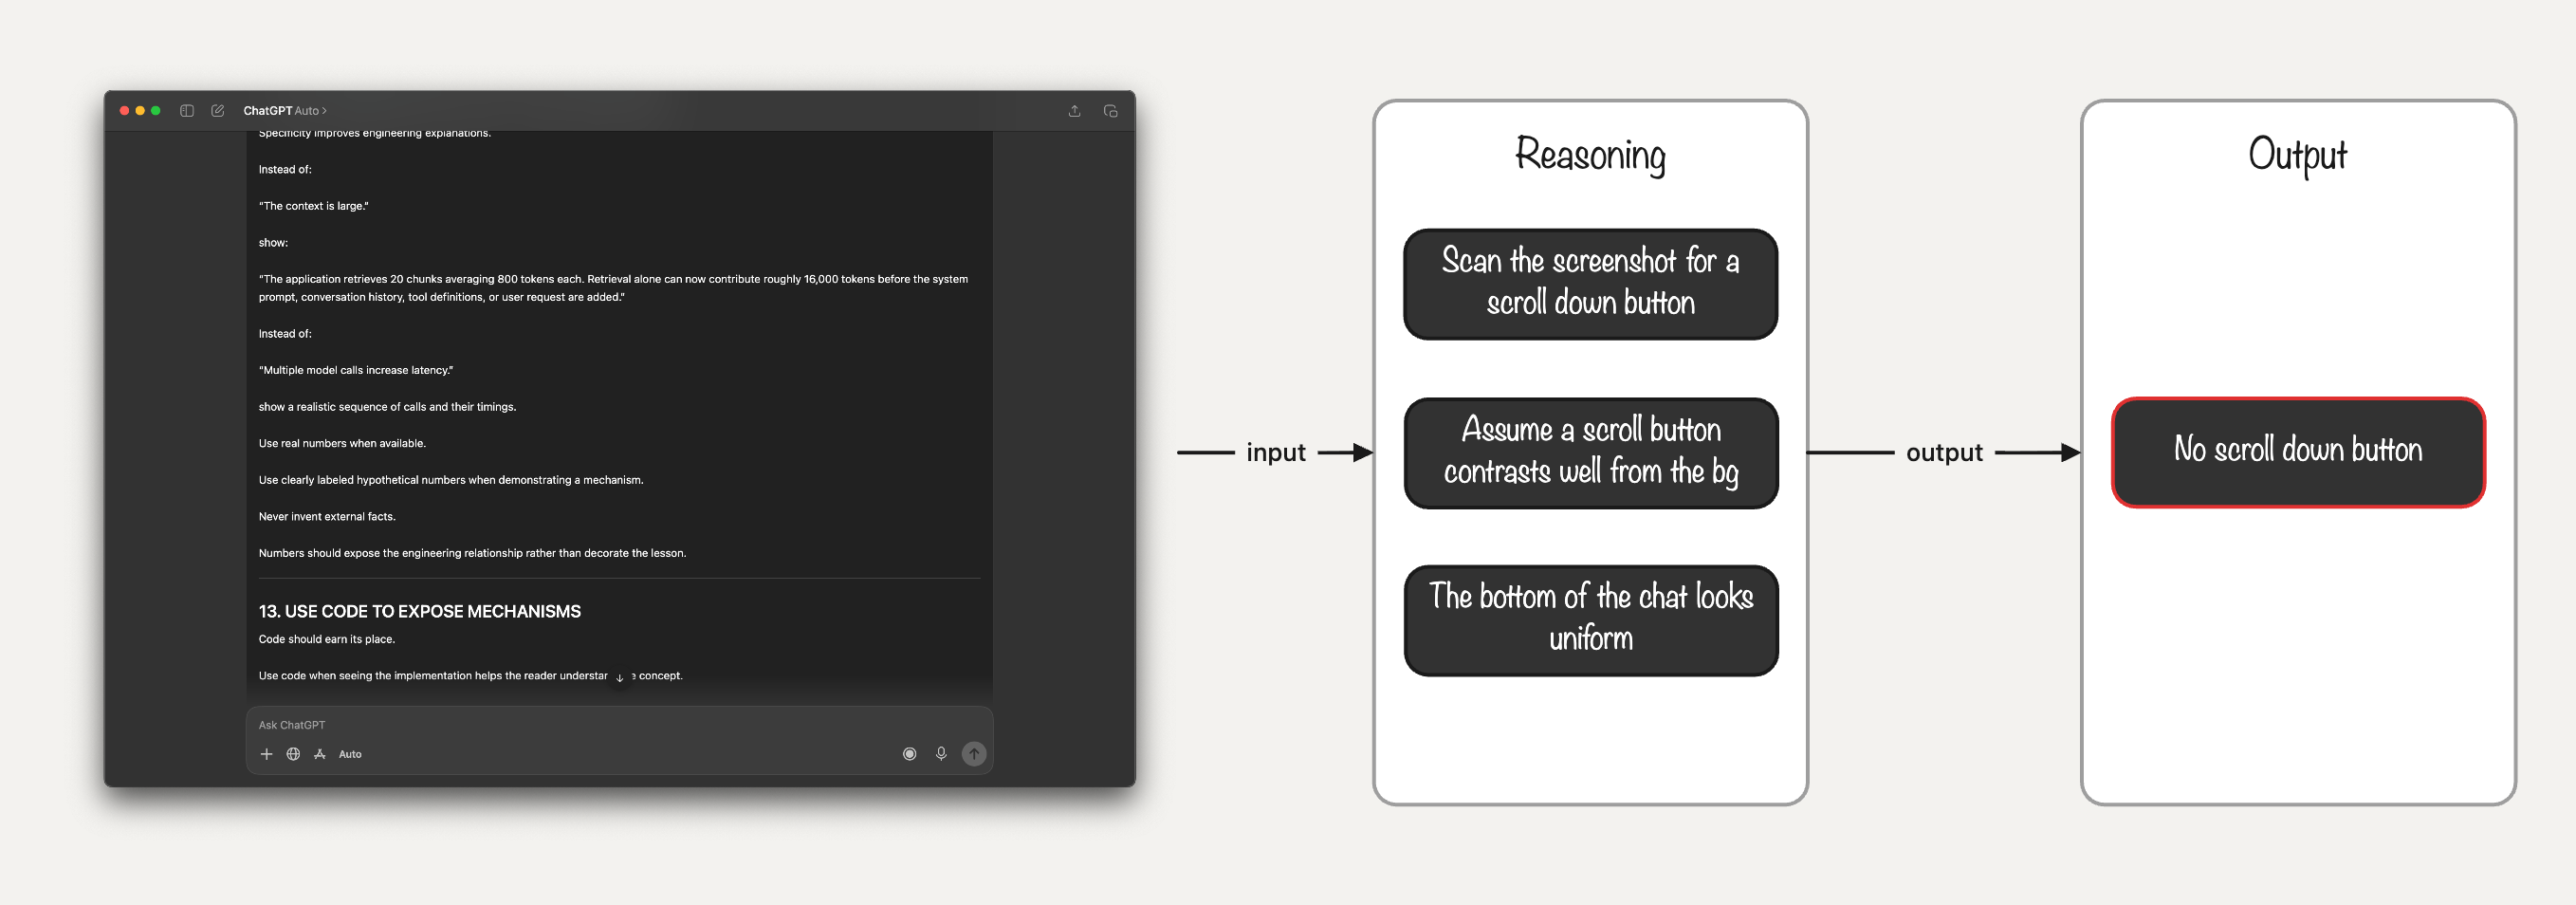
That reasoning is the model’s own account of what it did, written by the same model that got the answer wrong. Research on chain-of-thought has found that these accounts often leave out what drove the answer (the section on the model’s account below goes through the evidence), so it was a lead I still had to test. What the trace could prove was a different kind of thing. It held the exact screenshot and prompt the detector received, and the raw answer that came back, and those are records of what ran.
This looks small because the example is one screenshot in and one answer out. Doing it for every step of a real system is not small, because the judgment happens inside a vision model, so there's no classifier to open up and no threshold to print. Making an AI system’s work visible means recording what each step received and returned, with the model’s explanations kept next to that record and labeled as the model’s own account. Then you test an explanation before you act on it.
What a trace is
A trace is one run, broken into steps
A trace is the record of one run, broken into the steps the system took. Each step is one operation, a single model or tool call, and the trace keeps its input and output plus the exact call it made in between, each stamped with when it happened. Line the steps up in order and you can see the exact path the run took.
Take the scroll down button detector from the last module, the component that reads one screenshot and answers whether a scroll down button is on the page. Its whole run is a single model call, so its trace is just that call, holding the screenshot it saw and the answer it gave back. Nothing else happens inside it, so that is the entire trace.
The detector was one small component inside a much larger system, though. A real run passes through many components like it, and each one makes its own calls that can go wrong in their own way. They all need the same recording, so that when the system fails you can open any component and see what it did.
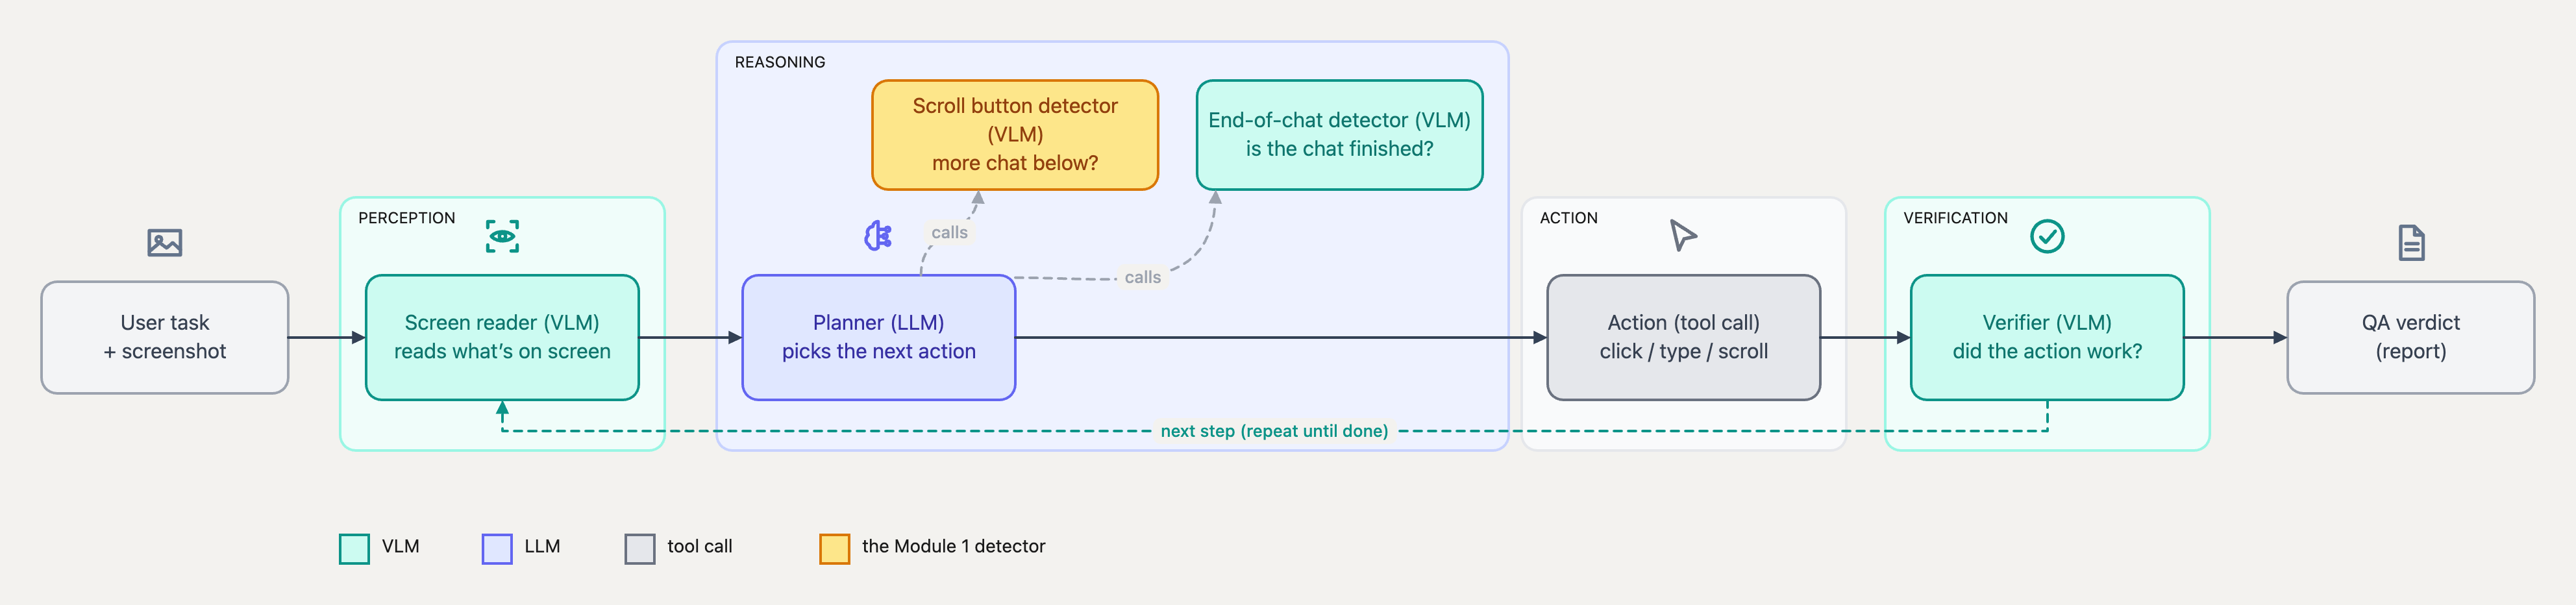
In the agent, one step’s record is concrete. It holds the screenshot and prompt that went in and what the model returned, plus any tool or action it fired and the result that came back. Read the steps top to bottom and you have every input and output, and every call the system made, in the order they ran.
The tool I used for observability and tracing was Langfuse. It records every run as a tree of steps I can open one at a time, so a task that failed deep in a long run is a few clicks from the exact step that broke. Without that record, a failed run is one wrong result at the end, with no way back to the step that caused it.
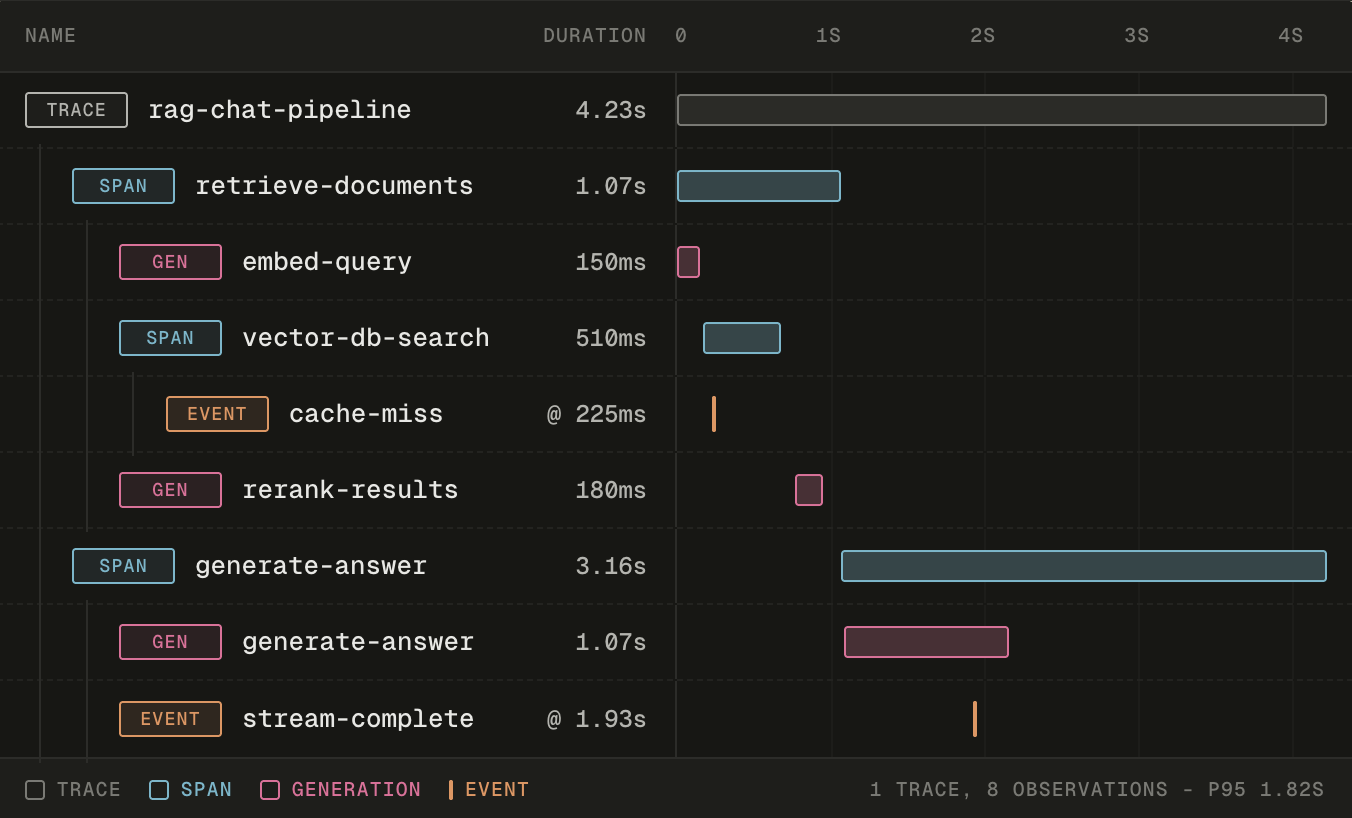
Same idea, different words
Every trace tool records the same shape
Everything so far describes a shape that every tracing tool shares. A run is recorded as a tree of steps, and each step is a model or tool call with its inputs and outputs. What changes from one tool to the next is only the vocabulary on the boxes.
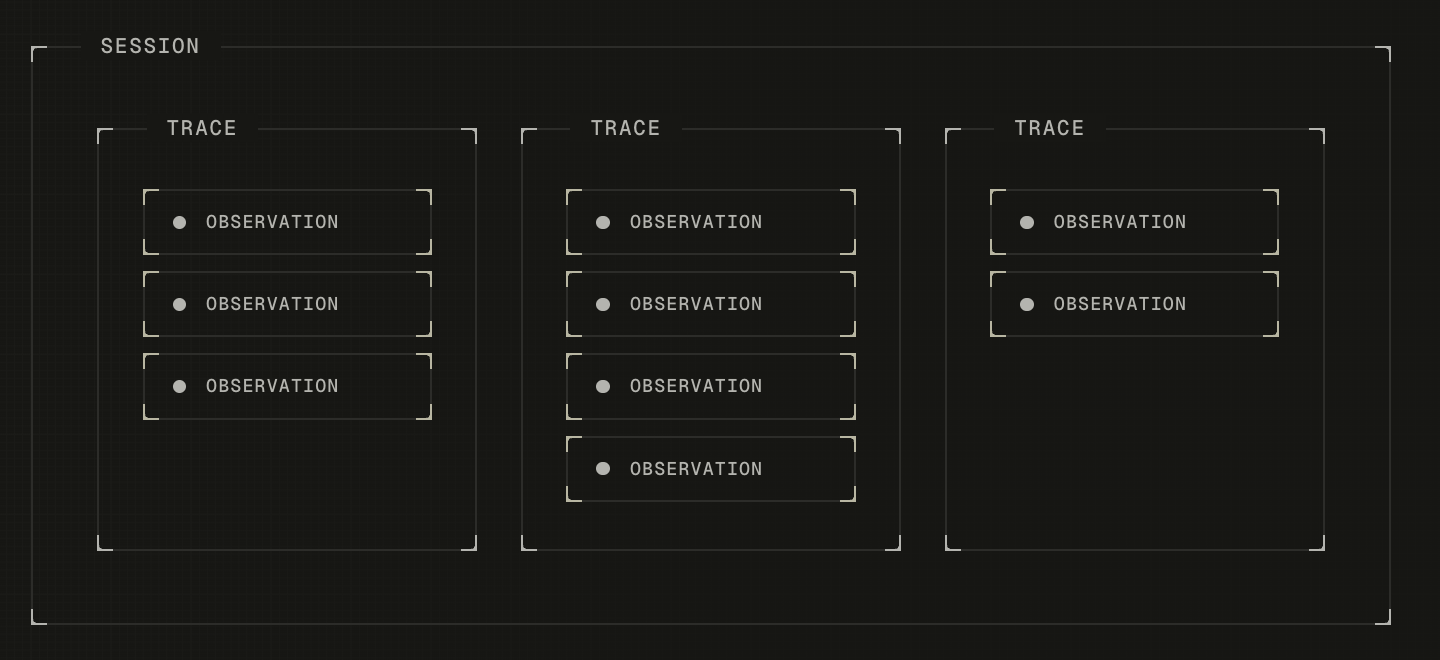
The tool I used, Langfuse, calls the whole run a trace and each step inside it an observation, and it groups related runs into a session, so one user conversation is a single session made of many traces. OpenTelemetry, the vendor-neutral standard most tools build on, calls each step a span and the tree of them a trace. The labels differ. The nesting is the same, so once you can read one trace viewer, you can read any of them.
That is why it is worth trying more than one of them. You are learning the structure every one is built on, so pick whichever you like and go deeper.
What to capture
Log enough to debug a step without re-running it
A trace only helps if the right things are inside it, and the common mistake is logging too little, usually the final answer and maybe an error, with nothing kept about the middle. Go back to the system diagram. Every arrow between those boxes is data moving from one component to the next, and every box is a decision. If you keep only the endpoints, a failure in the middle is invisible again.
Log this at every step
- Every input and output, as the real thing. The actual screenshot a component saw, and the text or document the next one produced from it. Keep the image itself, or a pointer to where it's stored, along with a hash of its bytes and the time it was captured. A note that says “an image was passed” can't show you that the image was the wrong one.
- The full prompt, exactly as it reached the model. Every variable already filled in, in the form the model received it. The bug often lives in what got interpolated into the prompt, and only the filled-in version shows it to you.
- The raw output, plus any reasoning text the API returns. The unparsed response, before your code trims it down to a yes or no. If the API returns reasoning or a reasoning summary, keep it too, labeled as the model’s account. The next section covers how much weight it can carry.
- Which model, and its settings. The model name and version, and the settings you set, like temperature and the output token limit, plus the stop reason the API returns. So you can catch a step that quietly fell back to a smaller model, or an answer that was cut off because it hit the limit.
- Every tool call, with its arguments and its raw result. Which tool the agent called and what it passed in, plus the raw result before any cleanup and its length. Agents fail by calling the wrong tool or handing it the wrong argument, and a result your code shortened before the model saw it looks fine unless you logged its length.
- Cost and latency, per step. The tokens and dollars a step spent, and how long it took. This is how you find the one slow or expensive step later, with no guessing at the whole run.
- Failures and retries. When a step failed and tried again, and how many times. A step that only worked on its third try is a step that mostly does not work, and a trace that hides the retries hides that.
- Enough labels to slice by later. What kind of input it was, and a version tag for your prompt or system. So you can pull every failure on markdown inputs, or everything since your last change, with no scrolling through runs by hand.
Some of this can't be stored as-is, like API keys and the personal data inside a screenshot. The section on what the trace keeps covers redaction and how long any of it stays.
The rule underneath all of this is to log enough that you could explain what any step received and what it returned without running it again. If the trace can’t answer that, you logged too little.
Execution evidence vs explanations
The trace proves what ran, and the reasoning is the model’s account of it
One step’s record holds two kinds of evidence, and they carry different weight. Most of it is execution evidence, which your code wrote down as the step happened. The reasoning text is something else, because the model generated it, the same way it generated the answer.
| Field | Kind | What it can establish |
|---|---|---|
| Screenshot sent, with hash and capture time | Execution | Which image the model received, and when it was taken |
| Rendered prompt | Execution | The exact instructions and variables the model saw |
| Tool arguments and raw result | Execution | What the tool was asked and what came back |
| Model, version and settings | Execution | Which model produced the answer, under which settings |
| Timestamps, retries and stop reason | Execution | The order things ran in, and whether the output was cut off |
| Reasoning text or summary | Model’s account | One possible explanation of the answer, to be tested |
The last row is weaker for a reason researchers have measured. Turpin and colleagues (2023) reordered the answer options in few-shot prompts so the correct answer was always “(A)”. The models picked up on that pattern and their answers shifted toward it, but their step-by-step explanations systematically failed to mention it, and accuracy dropped by as much as 36% across 13 BIG-Bench Hard tasks on GPT-3.5 and Claude 1.0. Anthropic ran a similar test on reasoning models (April 2025) by slipping a hint to the answer into the prompt. When the models used the hint, Claude 3.7 Sonnet mentioned it in its reasoning 25% of the time and DeepSeek R1 39% of the time. Those were 2023 and 2025 models and newer ones may do better, but a reasoning text is still something your code can't check against what happened inside the model.
Often there's no reasoning text to read at all. As of September 2026, OpenAI's API doesn't return a reasoning model's raw reasoning tokens, only an optional summary of them (OpenAI reasoning guide), and Anthropic's documentation shows its current models returning summarized thinking blocks (extended thinking docs). A model called without reasoning returns none, and if you ask it to explain itself in the output, that explanation is the model’s account again.
A plausible explanation for the wrong screenshot
This run is made up to show the pattern, and so are its times. Suppose the QA agent reports a half-read conversation, and walking the trace back lands on the scroll down button detector at step 7, which answered “no button”. Its reasoning says the bottom of the chat looks uniform and a button there might blend into the dark background. That sounds right, and it even matches the faint-button problem from the first section, so the obvious move is another round of prompt edits.
| Field | Step 6 | Step 7 |
|---|---|---|
| Action before this step | none | scroll down, finished at 14:02:07.650 |
| Screenshot capture time | 14:02:06.910 | 14:02:06.910 |
| Screenshot hash | 9f3a…c21 | 9f3a…c21 |
| Detector answer | button present | no button |
The screenshot at step 7 was captured before the scroll finished, and its hash matches step 6’s, so it's the same image. The capture helper had returned its last frame because the new one wasn't ready yet. The detector was judging a page that no longer existed, and its reasoning explained a miss on the image it was handed, which happened to be stale. No prompt change would fix that, because the model never received the current page. The fix goes in the capture helper, which has to wait for a frame taken after the action finished.
The model’s explanation was fluent and plausible, and the trace showed it was about the wrong input. So check what the step received before you read what it says about itself.
Cost and latency
The trace shows where time and money go
A trace records how long each step took and how many tokens it used, so it answers two questions the final output never does: where is this run slow, and where is it expensive. A single QA task runs many model calls, so its latency and its cost are both the sum across every step. The trace breaks that sum apart and shows which step took most of it.
Latency is what the user feels. An agent that takes 5 minutes to answer feels broken, even when the answer is right. Open the trace and the slow step is the longest bar, usually one model call doing the heavy work, sometimes a tool call waiting on a slow API. You optimize that one step, because the trace told you where the time went.
Cost is real money. Every model call spends tokens, and tokens have a price, so a run that quietly makes ten calls costs about ten times what a single call would. The trace shows the tokens each step used, so you can find the one prompt that is far too long, or the step that reaches for an expensive model when a cheap one would do.
Watch all of these across many runs, because any single run can be fast by luck. Track the P95, the slow-tail latency that only some of your users hit, because that is the number that decides whether the system feels reliable.
Read the trace before you optimize anything. The slow or expensive step is almost never the one you would have guessed.
Reasoning across hops
The failure you see is rarely the step that caused it
In a run with many steps, each step hands its output to the next. The screen reader’s text goes to the planner, the planner’s decision goes to the action, and on down the line. When something goes wrong, the step that visibly fails is usually not the step that caused it. A wrong answer early gets passed forward, and every step after it does something reasonable with bad input, until the mistake finally shows up at the end.
Follow the scroll down button detector through a real run. Remember what it does: it looks at a screenshot and answers whether there is more conversation below. Suppose it says “no button” when a button is sitting right there. That wrong answer does not stay put. The planner reads “no button” as “this is the whole conversation,” so it stops scrolling and treats a half-loaded page as the full chat. The verifier checks the screen after the action and sees nothing wrong, so the run keeps going and the agent produces a QA result for a conversation it never finished reading.
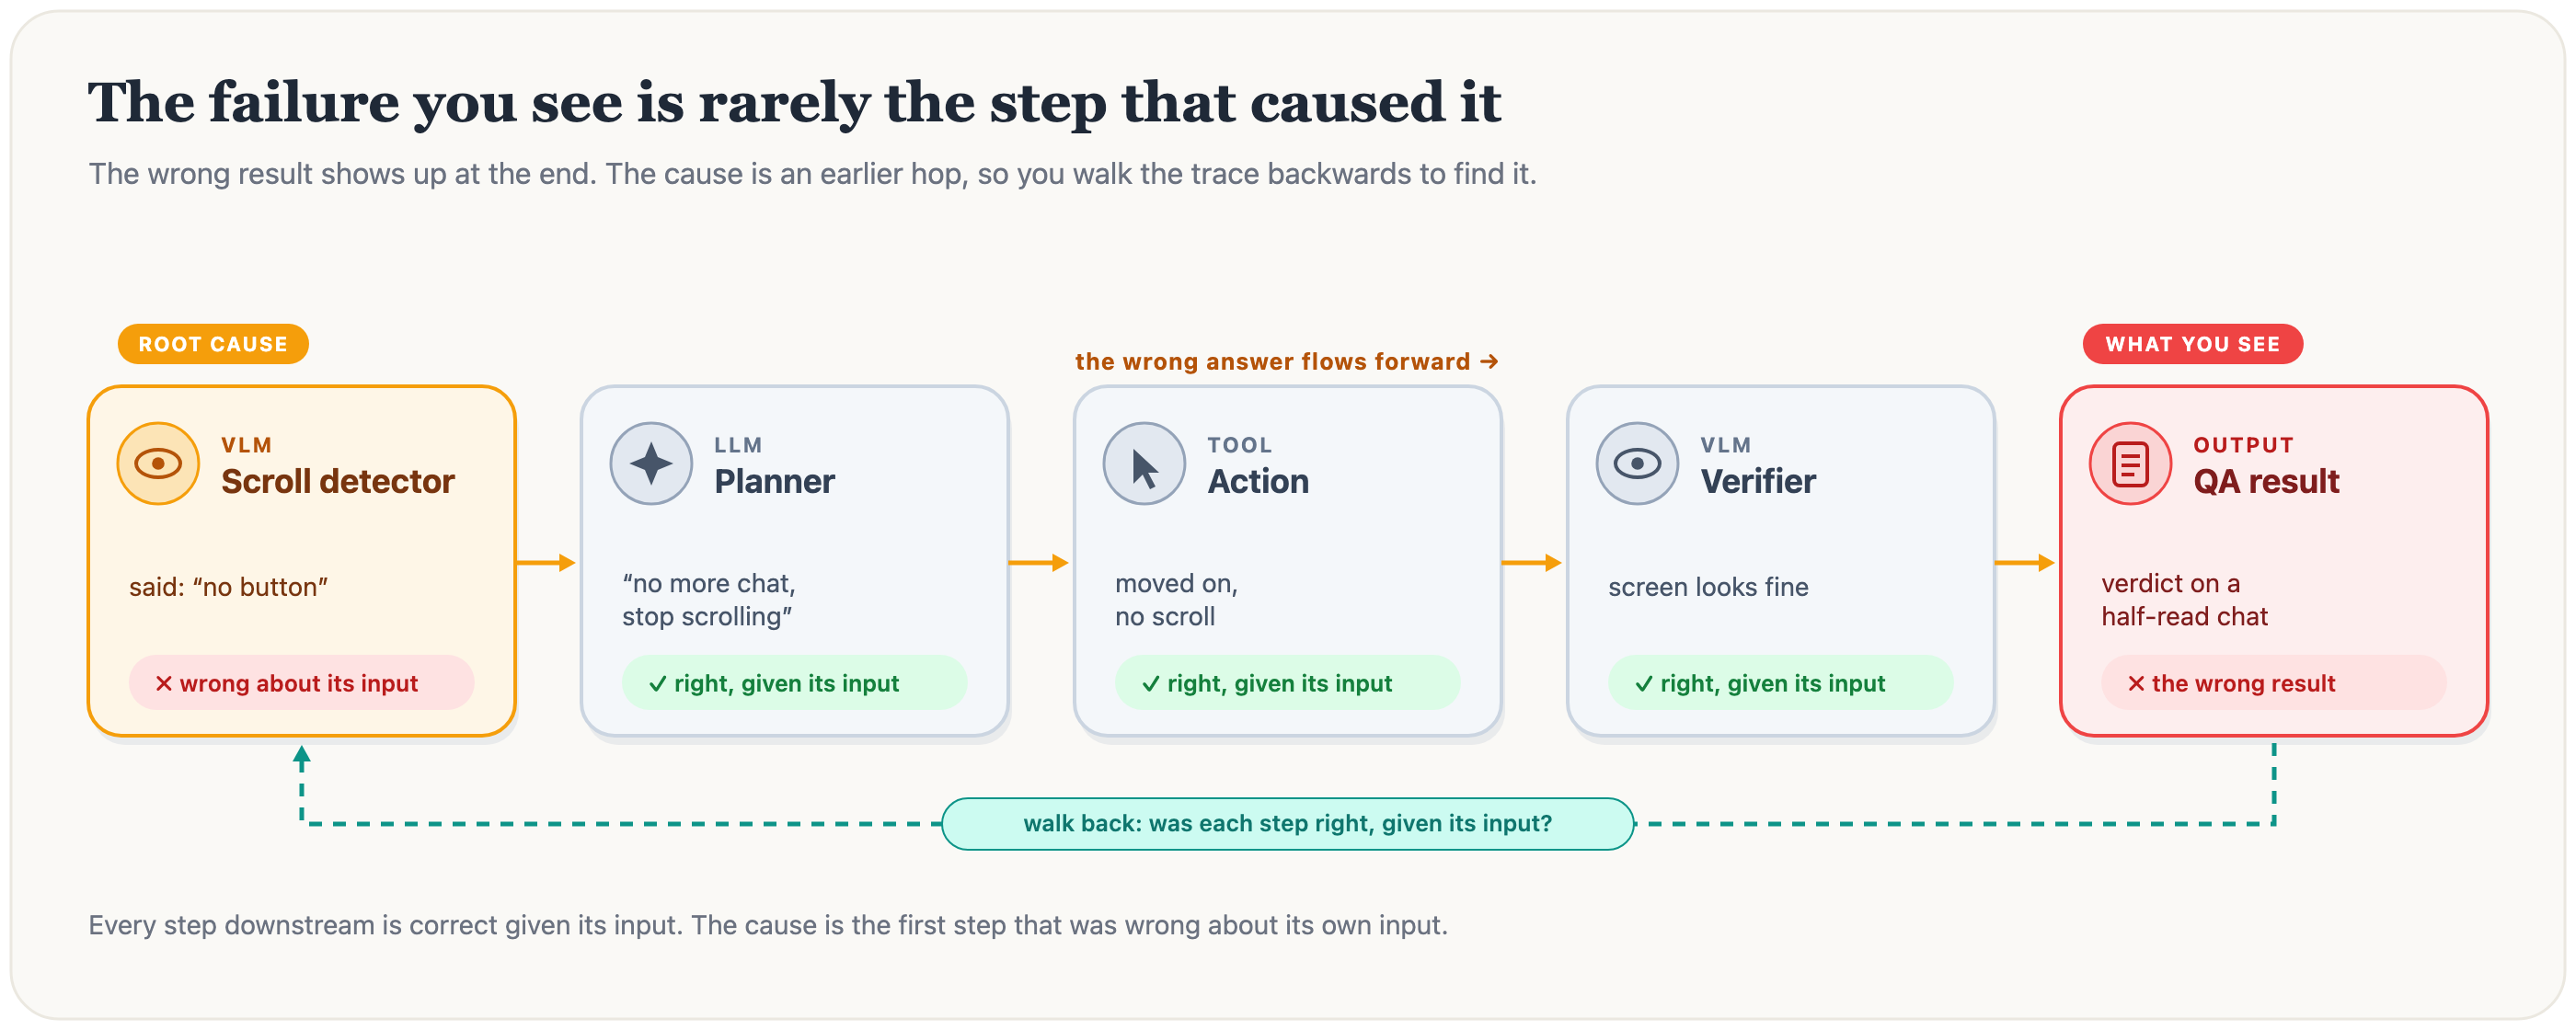
What you see is a wrong result at the end, and the last step looks fine, because given what it was handed, it did exactly the right thing. So did the step before it. If you only look at the step where the failure showed up, each step looks correct on its own, and you get nowhere.
The trace lets you walk backwards through the whole thing, so you open the failing run and read each step’s input and output in order, from the end toward the start, asking one thing at each hop: was this step right, given what it received? The verifier was right about a half-loaded page. The planner was right to stop, given a “no button.” The detector was the first step that was wrong about its own input, because the screenshot it received has a button in it and it answered that there wasn't one. That is the hop that caused everything after it.
The walk-back needs nothing from the model’s reasoning. Each question compares a step’s recorded input with its recorded output, which is why the per-step logging from earlier makes it possible. A trace that keeps only the final output can tell you the run failed. One that keeps every hop lets you find the one decision that failed, several steps before the symptom showed up.
Debugging without reasoning text
Debug the step from what it received when there’s no reasoning to read
Once the walk-back has found the step, the next question is why it went wrong, and most of the answer sits in the execution evidence. Go through it in this order, because the early checks are cheap and each one rules out a cause that no prompt change could fix.
- 01Was the input the one you meant? Check the screenshot’s capture time against the action before it, and its hash against the previous step’s. For text, check the length and the source. The stale screenshot in the section above fails this check.
- 02Was the prompt assembled correctly? Read the rendered prompt and look for a variable that came in empty or from the wrong place, like a previous user’s conversation.
- 03Did every tool result reach the model whole? Compare the tool’s raw result with what went into the prompt. A result that ends at an exact round number of characters has usually hit a limit in your own code.
- 04Did the model run under the settings you expect? Check the model version and the stop reason. A stop reason that says the output hit its token limit means the answer was cut off before it finished.
- 05Did timing change what happened? Look for a retry that landed on a fallback model, or a step that ran before the one it depends on had finished.
- 06Then look at the output itself. If every input was right and the answer is still wrong, the model misjudged a correct input. That's the point where a prompt change or a different model is the right fix, and where reasoning text, if there is any, gives you a lead.
The scroll detector’s faint-button misses pass the first five checks. The screenshots are current, the prompt is filled in correctly, and the answer finished normally, so the problem is the model’s judgment on a correct image. You can reach that conclusion with no reasoning text at all. What the reasoning added was a guess at which part of the image the model got wrong, and a guess like that needs a test.
Paired traces
Compare a run that passed with one that failed
A failing trace on its own shows you everything that happened, which is a lot to read, and most of it is normal. Put it next to a passing run of the same task and most of it cancels out. The fields that differ are where to look.
Pick the pair carefully. The two runs should be as close as you can get, meaning the same task and the same prompt version, so that the differences you find are few, and inputs that look alike help too. Then go down both traces step by step and compare the execution fields, especially input lengths and hashes, and the tool results.
These numbers are made up, like the run in the section above. The two runs are QA checks on long conversations with the same prompt version, and one caught a problem in the last few messages while the other missed it.
| Field | Passing run | Failing run |
|---|---|---|
| Screen reader output length | 5,912 chars | 12,847 chars |
| Transcript length in the planner’s prompt | 5,912 chars | 8,000 chars |
| Last message in the planner’s prompt | the conversation’s final reply | a reply from the middle of the conversation |
| Planner stop reason | end of turn | end of turn |
The failing run’s screen reader produced 12,847 characters, and the planner received exactly 8,000. Something between the two cut the transcript at a round number, which points at a limit in your own code, like a helper that trims text to keep the prompt short. The planner never saw the end of the conversation, so it couldn't flag a problem there, and nothing in the planner’s output or reasoning would tell you that. The passing run was short enough to fit, which is why it looked fine.
Keep passing runs around for this. A trace store that holds only failures leaves you nothing to compare against, which comes up again when you decide what to sample later in the module.
Explanations as hypotheses
Test the model’s explanation before you act on it
When the reasoning does offer an explanation, treat it as a hypothesis, meaning a claim you can check with a run. For the scroll detector, the claim was that it misses a button when the button blends into the background. If that's true, the misses should follow the contrast between the button and what's behind it, and changing only the contrast should change the answer.
The test starts with controlled inputs. Take one missed screenshot and make a copy where the only change is a higher-contrast button, then take one caught screenshot and make a copy with the button darkened toward the background. Each pair differs in one thing, so if the answers flip with the contrast, the claim holds up. Decide before you run it what would count against the claim. If the higher-contrast copy is still missed, contrast isn't the cause, which means the explanation was wrong even though it read well.
If the claim holds, change the one instruction it points at, like telling the detector that the button can sit on nearly the same shade as the text and where it usually appears. Then rerun the failing test cases and the passing ones. The failing ones tell you whether the fix worked. The passing ones tell you whether it broke something, because an instruction to look harder for faint buttons can also make the detector report buttons that aren't there. That would lower precision, the share of its “button” answers that were right, which M1 covers.
That test can come out either way. If it holds, you've fixed the cause and you know why. If it doesn't, you've saved yourself from shipping a prompt edit built on an explanation the model made up, and you go back to the execution evidence.
Write a script that tests one hypothesis about my scroll-down-button detector, which is that it misses buttons with low contrast against the background. For each screenshot in hard_cases/, create a copy with the button region's contrast raised, and for each in easy_cases/, a copy with it lowered. The button's bounding box is in labels.json. Run the detector on the originals and the copies, and print a table of original answer vs modified answer per image. Don't change anything outside the button's bounding box.
Closing the loop
Observability finds the bug, the eval keeps it out
Walking the trace back gets you to the broken step. On the scroll agent that was the scroll down button detector, and the execution evidence showed its inputs were correct, so the problem was its judgment on a faint button. You do two things with that.
First, you fix the step, once the explanation has held up under a test like the one above. I rewrote the detector’s prompt to tell it that a scroll down button can sit on almost the same shade as the text, and where to look for it.
Second, you take the exact input that failed and add it as a test case to the ground-truth dataset from the last module. That screenshot, labeled with the right answer, now lives in the eval. The next time you run it, the regression check tells you whether the fix worked, and every run after that tells you if the same failure ever creeps back.
Those two habits are one loop with two halves. Observability tells you where a single run failed and gives you the evidence to test why. Evaluation tells you how often it fails across the whole dataset, and it catches the failure if it returns. So you build a raw system with tracing on from the start, watch real runs to see what it gets wrong, test and fix the step the trace points to, and add that test case to the eval. Then you do it again.
The trace shows where a run broke and what each step received, which is what lets you test an explanation of why. The eval shows how often it breaks and catches a fixed bug if it comes back. You want both running from the day you build the system.
Trace continuity
Keep one trace id across a queue
Everything so far assumed one run happens in one process, so every step lands in the same trace on its own. Real systems often split the work. Say the QA agent sits behind an API. A request comes in asking for a QA check on a conversation, the API puts a job on a queue and returns a job id, and a separate worker process picks the job up later and makes all the model calls.
Without any extra work, that run shows up as two traces with nothing connecting them. The API’s trace ends at “job enqueued”, and the worker starts a fresh trace with a new id, because the worker has no idea which request the job came from. When someone reports a bad QA result for a request, you find the API trace and it has no model calls in it, while the worker trace that has them is somewhere among thousands of others.
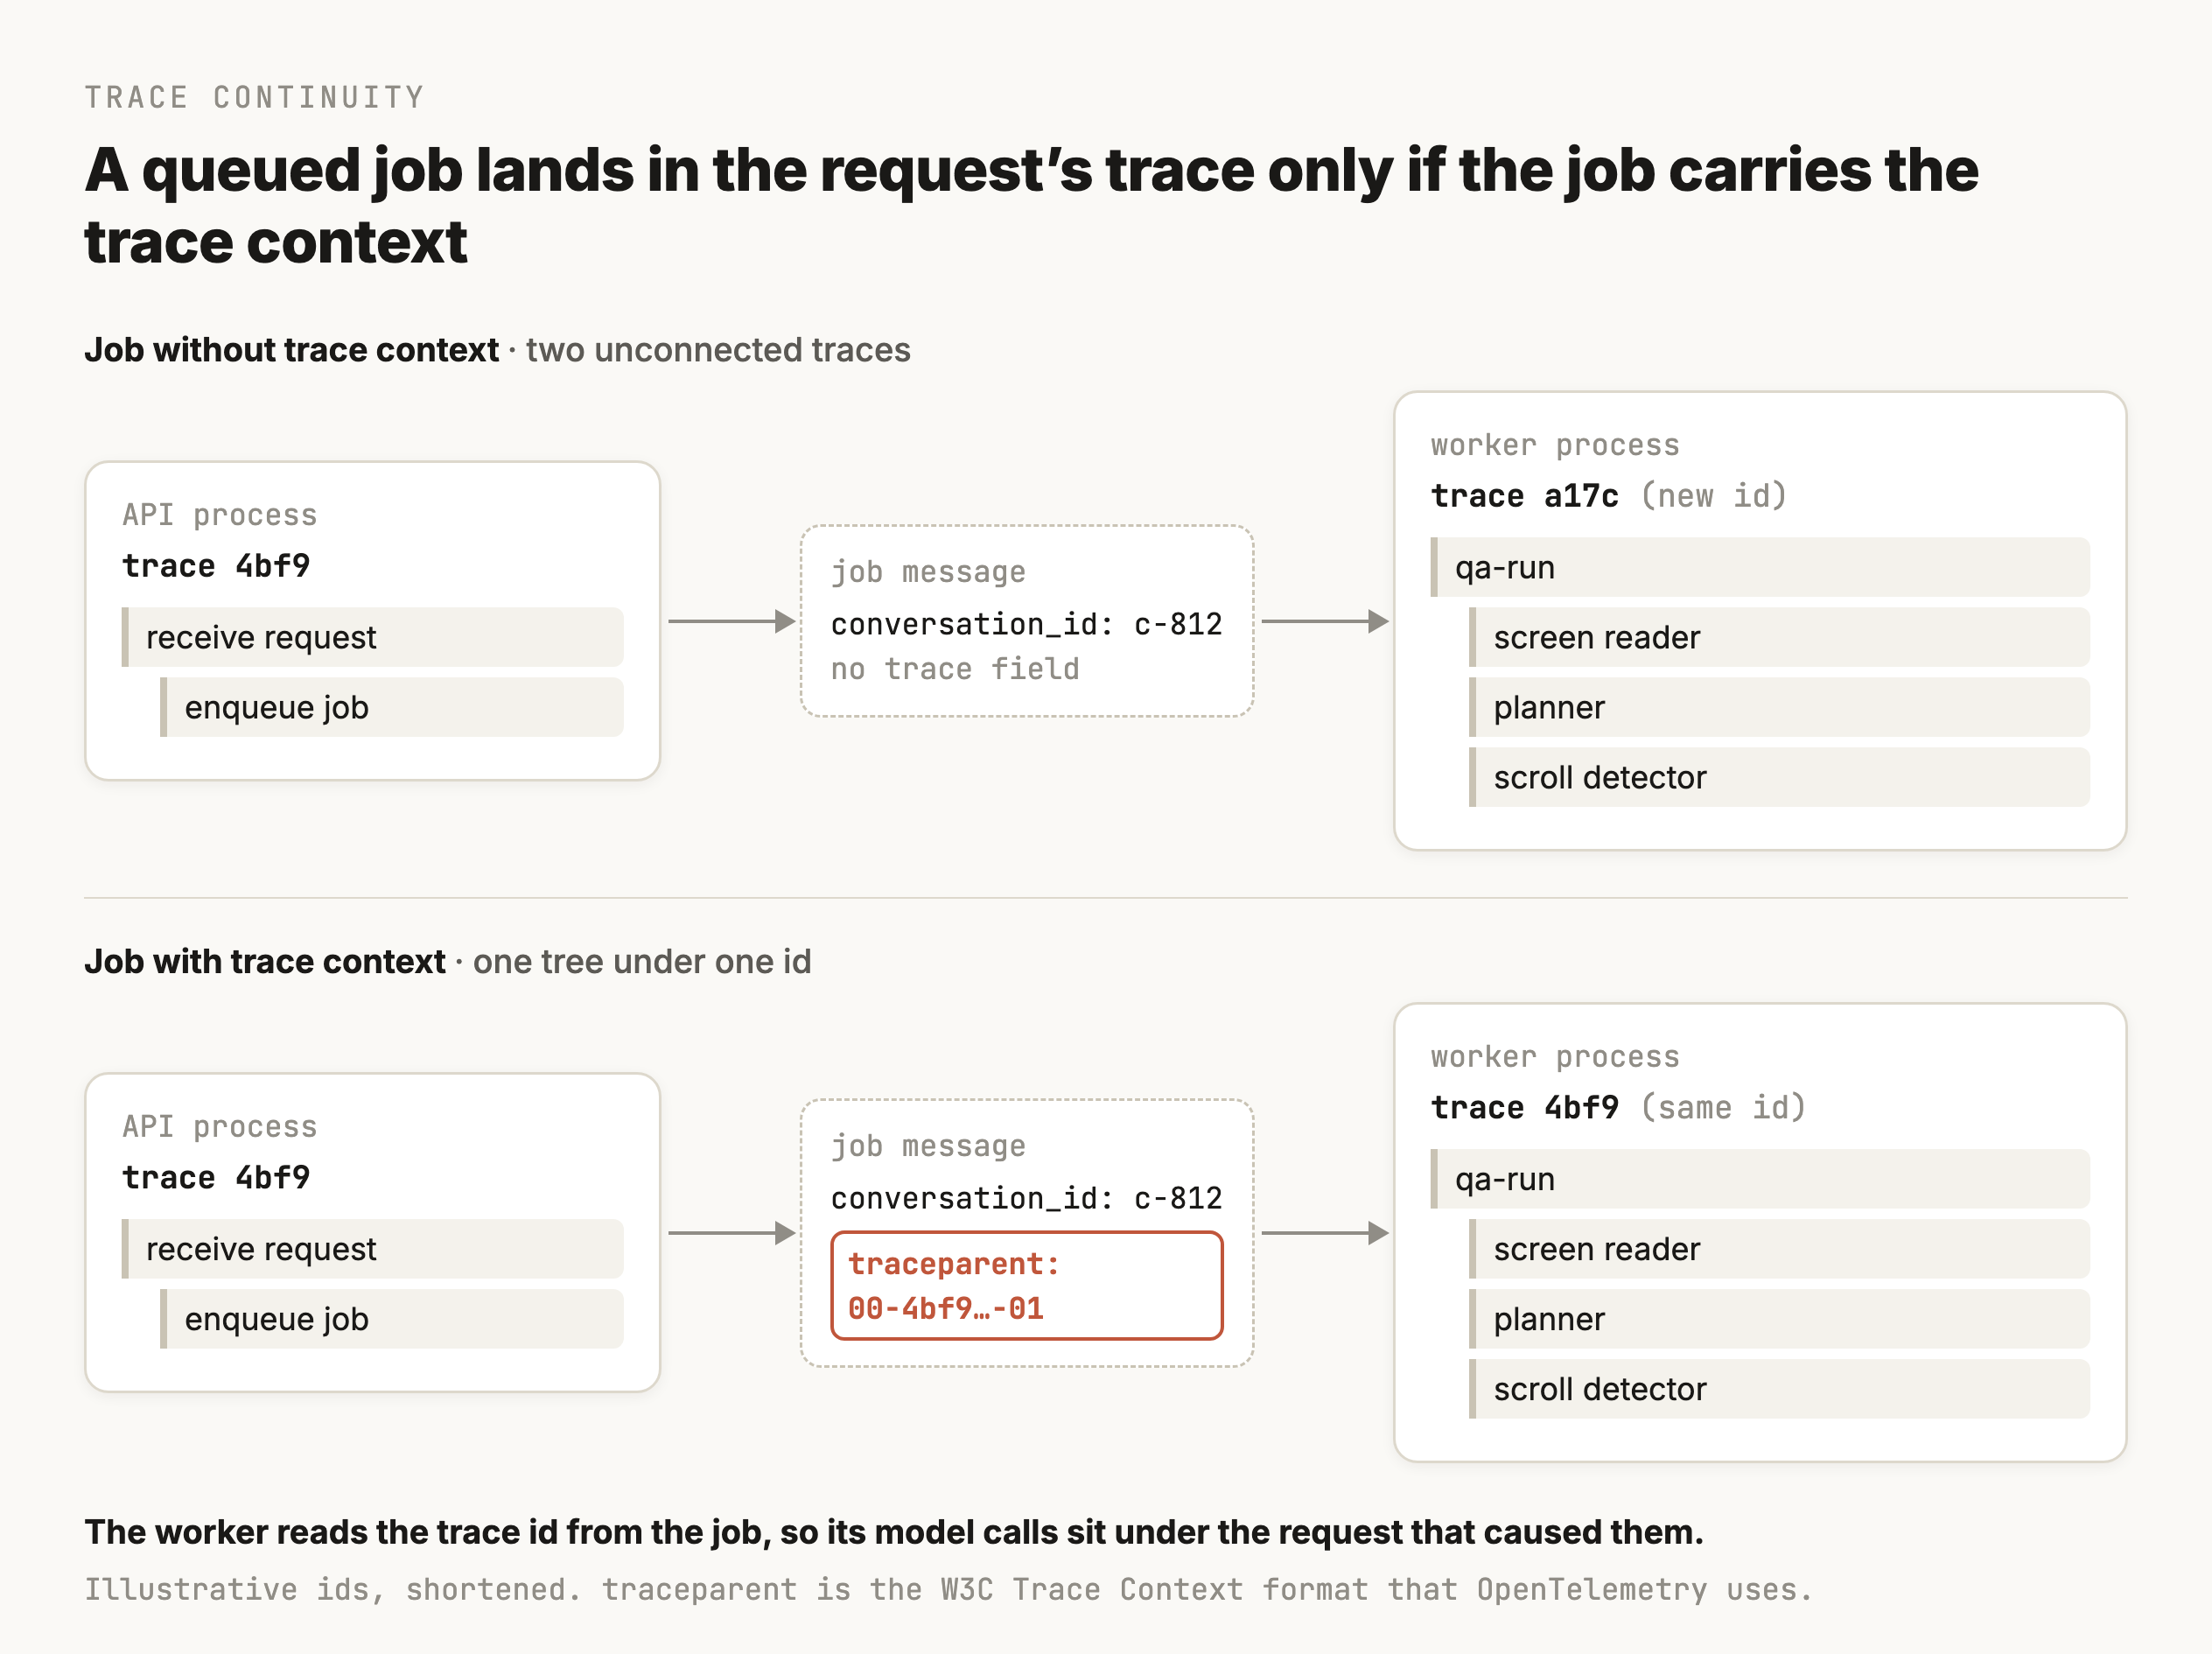
The fix is to send the trace context along with the job. OpenTelemetry’s context format, the W3C traceparent value, is a short string holding the trace id and the id of the current span. The API writes it into the job message when it enqueues, and the worker reads it back and starts its spans from it, so the worker’s model calls land under the request that caused them.
from opentelemetry import trace, propagate

tracer = trace.get_tracer("qa-agent")

# API process, inside the request's span
def enqueue_qa(conversation_id):
    carrier = {}
    propagate.inject(carrier)  # writes {"traceparent": "00-<trace id>-<span id>-01"}
    queue.put({"conversation_id": conversation_id, "trace": carrier})

# Worker process
def handle(job):
    ctx = propagate.extract(job["trace"])
    with tracer.start_as_current_span("qa-run", context=ctx) as span:
        span.set_attribute("conversation.id", job["conversation_id"])
        run_agent(job["conversation_id"])
Also put your own ids on the spans, like the job id and the conversation id, because those are what a bug report or a support ticket will quote. The trace id connects the spans, and your ids are how you find the trace in the first place.
Batch processing needs links. A worker that pulls a batch of jobs from different requests and handles them in one span can't have all of those requests as its parent. OpenTelemetry’s messaging conventions handle this by giving the processing span a link to each message’s context (OpenTelemetry messaging spans), and they use links as the default for connecting producers and consumers for that reason. A trace viewer that supports links lets you follow one from one trace to the other.
Logging choices
Decide what the trace keeps and for how long
The advice so far has been to log the real inputs, and for this agent that means screenshots of people’s chat windows at every step. Keeping every one of those forever costs storage, and it keeps other people’s conversations in a system your whole team can open. Each of these is a decision you make on purpose.
Redact where the data enters
API keys and personal data come out before anything is written to the trace, because a trace gets stored and shared. Do it in your application, so the raw values never leave it. Langfuse, for example, runs masking functions in your code before trace data is sent (Langfuse masking). A pattern can find an email address in text, but it can't clean a screenshot, so decide per step whether you need the image at all, or whether a crop of the region the step looked at will do.
Store big payloads once and point to them
A screenshot is far larger than everything else in a step’s record. Put it in object storage and keep a pointer to it in the trace, together with its hash, size and capture time. Those small fields are what caught the stale screenshot, and they cost almost nothing to keep, even after the image itself is gone.
Keep full payloads for a short window and the summary fields for longer
The per-step summary, meaning model and version, tokens, latency, hashes, lengths, stop reason and status, is small, so you can keep it for months and still chart trends from it. Full images and prompts are what you need to debug a specific run, and most debugging happens within days of the failure, so they can expire after a window you choose. Anything you turned into a test case gets copied into the dataset, where it's kept on purpose. A user’s request to delete their data has to reach the trace store too.
Keep every failing run and a sample of the passing ones
Sampling means recording only some traces. OpenTelemetry describes two ways to do it (OpenTelemetry sampling). Head sampling decides at the start of a run, before anything has happened, so it can't tell a failing run from a passing one. Tail sampling decides after it has seen all or most of the trace, so it can keep a run because of what happened in it, at the cost of holding every trace until it finishes.
With tail sampling you can keep every run that errored or needed a retry, and every run where a tool result was cut short or an output hit its token limit. Keep the runs slower than your latency limit and the ones a user or a reviewer flagged too, along with every run on a new prompt or model version for its first days.
Sample the clean passing runs at whatever rate your budget allows, and keep that rate above zero, because the paired comparison from earlier needs passing runs to compare against.
Your assignment
Lab
You have read how a trace works. Now put one into a system and use it to find a bug, test an explanation of it, and fix it. The goal is to feel the difference between a wrong answer at the end, a model’s explanation of it, and a trace that shows you which step received what.
The assignment
- 01Take a small multi-step system, three or four steps at most. It has to pass one step’s output to the next, so a mistake early can travel forward. A tiny agent works, or the scroll down button detector wired to a step that acts on its answer. Keep it small enough that a single run’s trace fits on your screen.
- 02Add tracing to every step. Describe each step to an AI coding tool and have it record the exact input and rendered prompt each step received, with a hash and a timestamp for images and files, and the raw output with its stop reason. Also record which model and tool it called and how long it took. Record reasoning text in its own field if your model returns any. Any tool works, from Langfuse to a plain JSON log you print yourself.
- 03Plant one execution bug. Make one step occasionally receive stale or truncated input, like the previous step’s screenshot or a transcript cut at a fixed length. Don't write down which runs it hits.
- 04Run it on 15 to 20 inputs, including ones you expect to fail. Open the traces and read a few end to end, so the shape stops being abstract.
- 05Find the planted bug with the reasoning hidden. Walk failing runs back to the first step that was wrong about its own input, then run the checks from the no-reasoning section on that step. Compare a failing run with a passing one to see what differs.
- 06Find a failure the planted bug didn't cause and test its explanation. Take a step whose inputs were all correct, read its reasoning or ask it to explain, and write the explanation down as a claim. Build a pair of controlled inputs that tests the claim, and run them.
- 07Close the loop. Fix the step the test pointed at, add the failing input as a test case to a small ground-truth dataset, and rerun the whole dataset, so you see both the fixed test case and any that the fix broke.
Deliverable
Two traces. The first is a failing run from the planted bug, with the execution fields that show the stale or truncated input and the passing run you compared it against. The second is a failure with correct inputs, with the model’s explanation and the controlled test you ran on it. Say whether the result supported the explanation. Then show the fix and the dataset rerun.
You’re done when:
- Your trace records what each step received and returned at every step of the run, with reasoning in its own field.
- You found the planted bug from execution evidence alone.
- You tested one model explanation with controlled inputs and can say whether it held.
- The failing input is now a test case in your eval, and you reran the passing ones too.
- The trace shows cost and latency per step, and you can name the slowest one.
Checkpoint · 16 questions
Check yourself
- 01
A step misbehaves. Your trace logs the prompt template and the variables separately, and the template reads correctly. Where is the bug you still cannot see?
- 02
A vision step gave a wrong answer. Your trace has the step’s text output and its latency, but you still cannot tell why it failed. What did you most likely fail to log?
- 03
The scroll detector says “no button” and its reasoning says the button probably blends into the dark background. The trace shows the screenshot’s hash matches the previous step’s, and its capture time is before the scroll finished. What do you fix?
- 04
Your dashboard shows a step at 99% success. The trace of one run shows that step succeeding only after two silent retries. What does the 99% describe?
- 05
A step returns the correct label, but its reasoning describes a check that makes no sense for the input. What should you do with that?
- 06
You're using a reasoning model whose API returns only a short summary of its reasoning, and one step is wrong. What can you still check with confidence?
- 07
A run fails at the end. Walking back, you find two steps with odd output, step 2 and step 5. Which is the root cause?
- 08
The planner misses problems at the end of long conversations. You compare a passing run with a failing one. In the failing run the screen reader produced 12,847 characters, and the planner’s prompt held exactly 8,000. What's going on?
- 09
A run takes 6 seconds. The trace shows planner 0.4s, retrieval (a vector-DB call) 4.8s, generate 0.8s. Your instinct is to shorten the prompts. What does the trace say?
- 10
Two steps in a run each take 2 seconds. A teammate says the run must be at least 4 seconds because of them. When is that wrong?
- 11
Step A calls a big model once. Step B calls a small model, but the trace shows it looped 20 times. Which likely costs more, and why can’t the output tell you?
- 12
You cut average latency from 3s to 1.5s, but users still say the agent “sometimes hangs.” What did the average hide?
- 13
Your QA API puts jobs on a queue and a worker runs the agent. A user reports a bad result for a request, and that request’s trace ends at “job enqueued” with no model calls. What's missing?
- 14
To cut storage, a teammate proposes keeping every failing trace and dropping all passing ones. What does that lose?
- 15
Answers on one step got worse overnight, with nothing changed on your side, and you have full traces. What is the first field to check?
- 16
You use a trace to find why a run failed and you fix the step. What makes the fix durable, so it stays fixed?
0 / 16 answered
Tools · Observability & tracing
I used Langfuse for this. These do the same job: LangSmith · Arize Phoenix · MLflow · Weights & Biases.
Not affiliated with any of them, and nobody is paying for a mention. Pick one and experiment.
Go deeper
Langfuse Academy (tracing) · OpenTelemetry: traces & spans · OpenTelemetry: sampling · OpenTelemetry: messaging spans and context propagation · Turpin et al. (2023), Language Models Don't Always Say What They Think · Anthropic (2025), Reasoning models don't always say what they think · MLflow tracing · LangSmith observability · Arize Phoenix tracing · W&B Weave tracing
That's the last one written so far
Pick your next module from the board.