
The capability
What is experimentation?
An experiment is a comparison where only one thing is different between the two sides. You keep one version as it is, change one thing in the other, and run both under the same conditions. If the results come out different, the only explanations left are your change and random chance, and this module shows how to work out how much of the gap could just be chance.
In an AI system you run experiments in two places. One is your eval dataset from M1, where you run two versions of a prompt or a model on the same test cases and compare the scores. The other is real users, where you split traffic between two versions and compare what happens to each group, which most people call an A/B test. The dataset is quick and cheap, but it only holds the inputs you put in it. Real traffic shows how customers respond, but it takes days or weeks, and some customers get the worse version while it runs.
An experiment tells you whether a change moved a number and by roughly how much. It can't tell you why the number moved, and a small difference can come from chance alone, so part of the job is working out how many users or test runs you need before you can trust the result.
Where it shows up
You'll need one any time you're trying to decide if a change is worth keeping. Switching to a cheaper model and rewriting a system prompt both need one before you can say they helped, and so does any change to how much history goes into each call.
Where this starts
February's numbers can't tell you what caused them
The flower delivery company from M7 shipped v1 in January. It answers policy questions from the help-center articles and hands everything else to the support team. February was the test, and the numbers came back good. First replies went from about 30 hours last February to about 6 this year, and the share of policy questions closed without a person reached 68%.
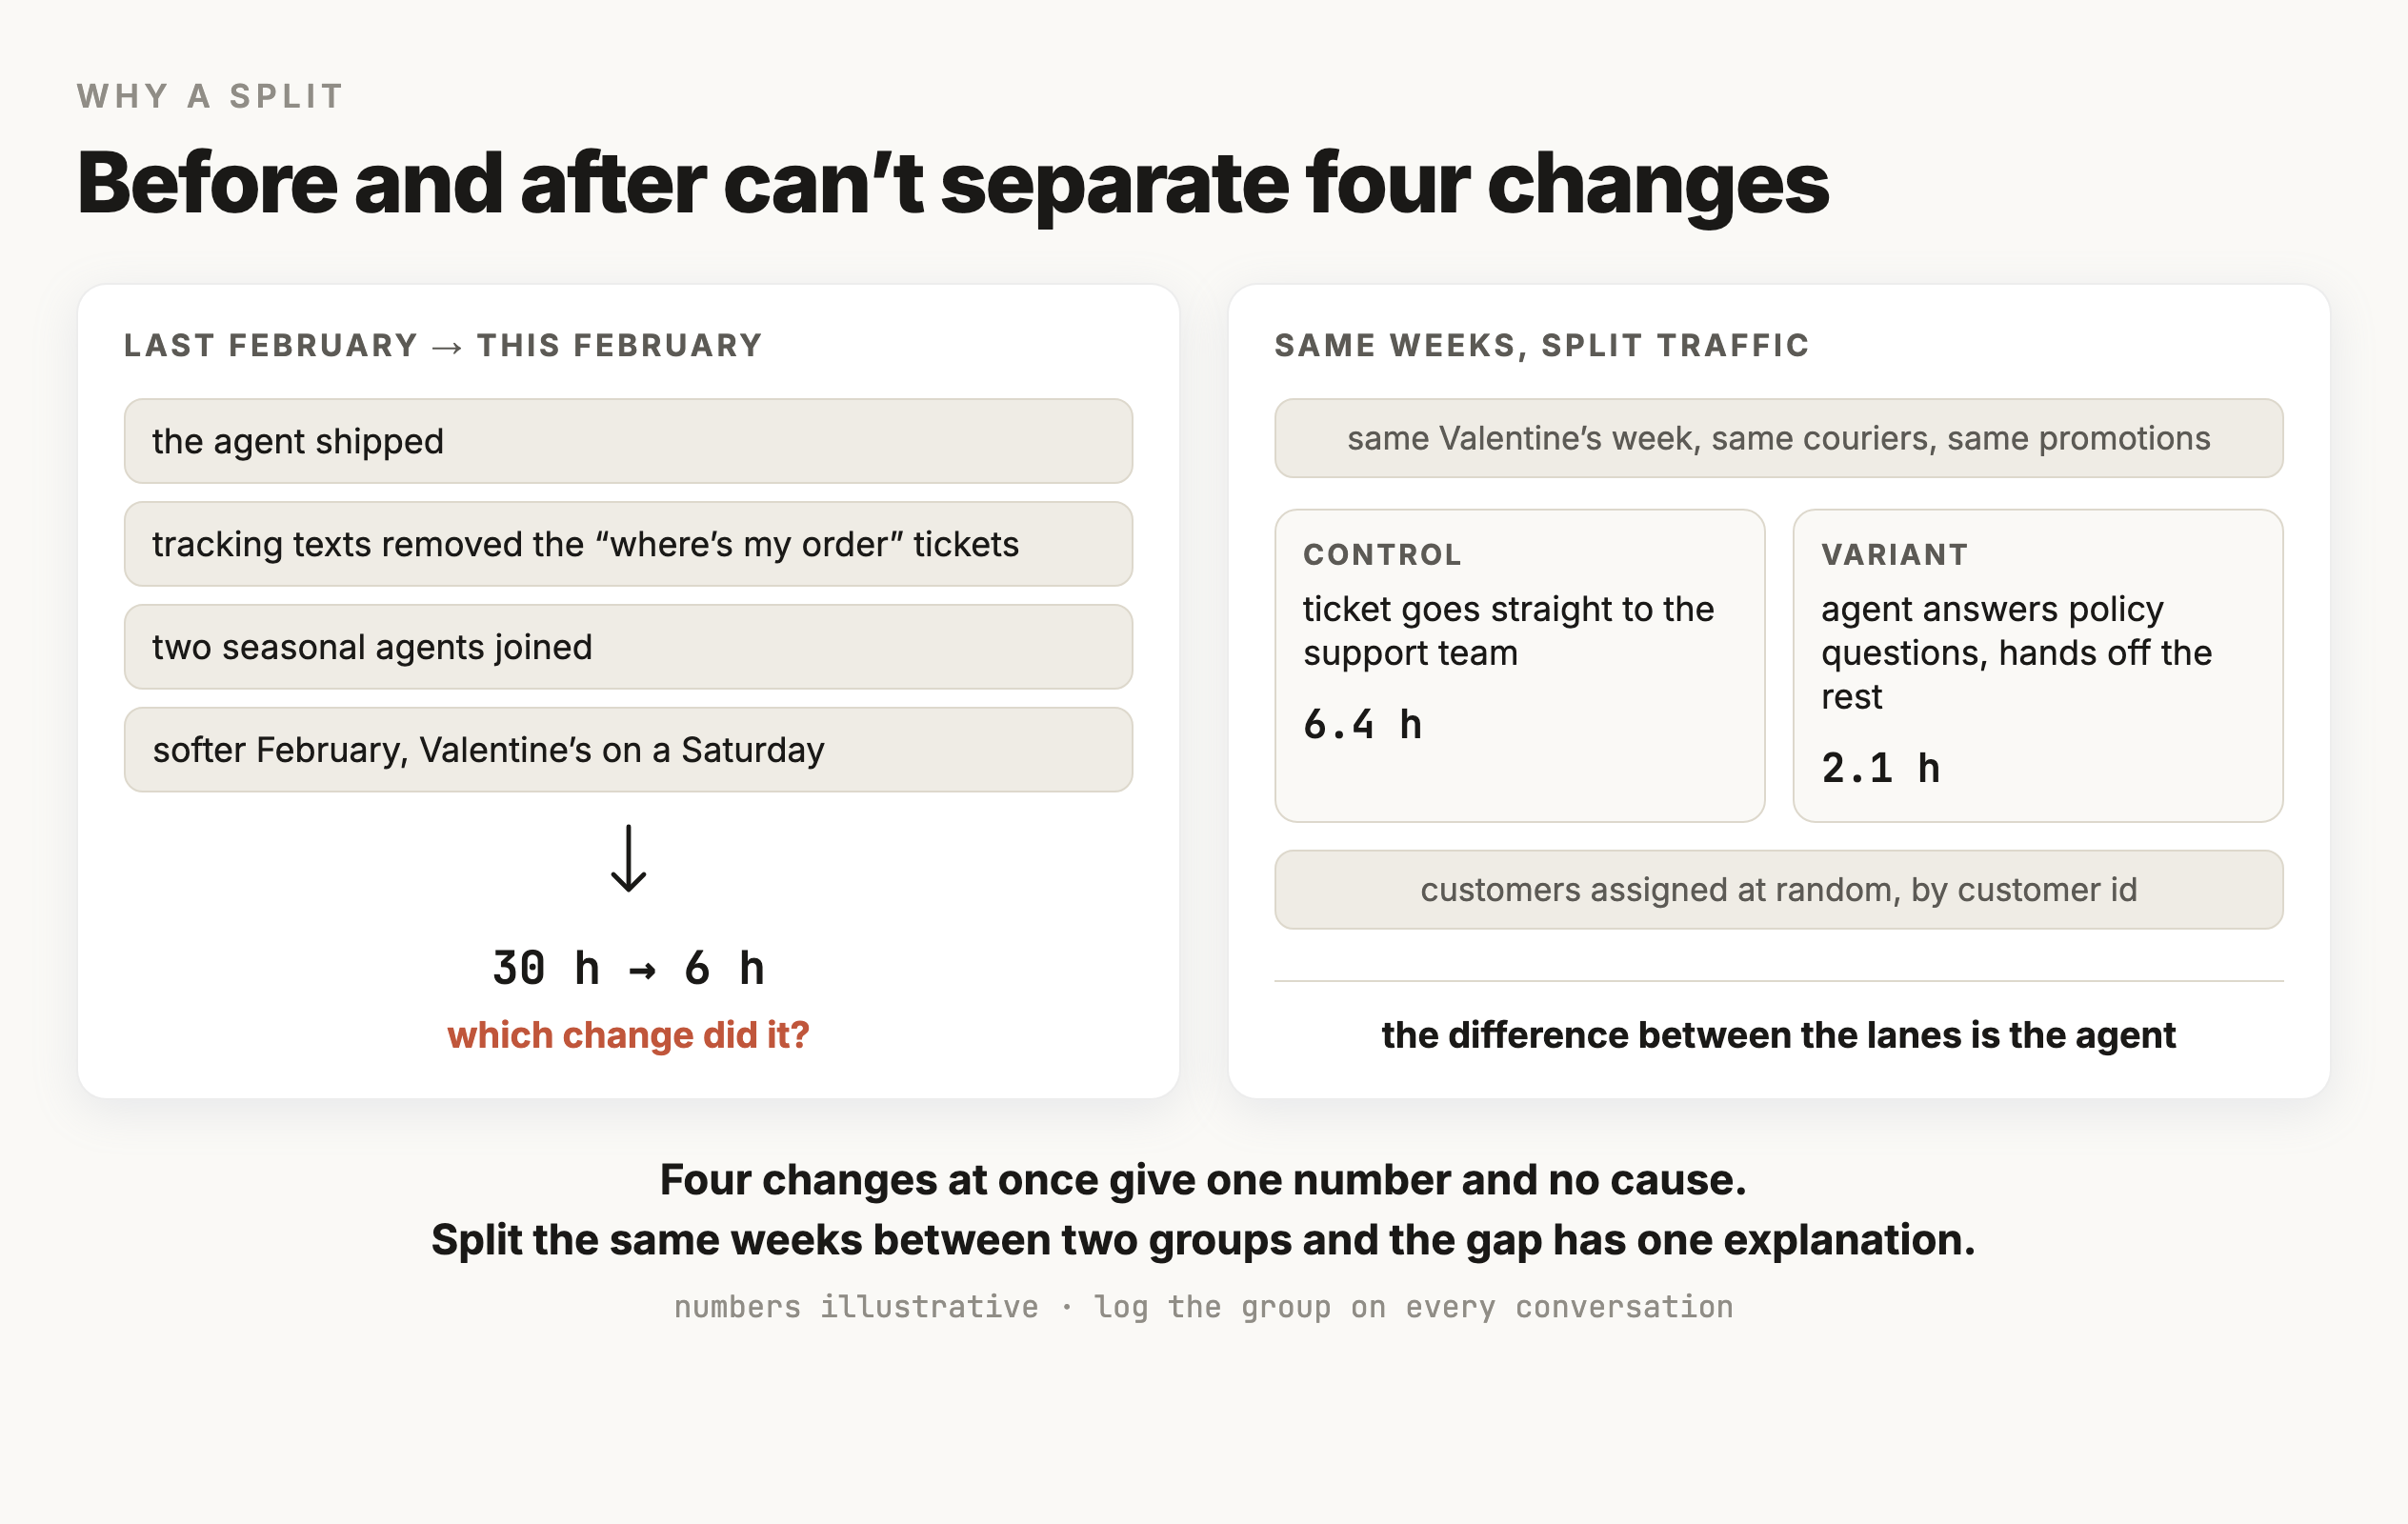
The head of support reads that as the agent working. The honest answer is that nobody knows yet, because four things changed between last February and this one:
The agent shipped, which is the thing being measured.
The tracking texts also shipped, and they took most of the "where's my order" tickets out of the queue, which is the 45% group from M7, so the team had more time for everything else.
Two temporary agents joined for the season, which is more people answering, with no software involved at all.
And February itself was different. Valentine's Day fell on a Saturday, and total orders ran under last year's.
Any one of those moves first-reply time. All four moved together, so the 30 hours to 6 hours belongs to the whole bundle. How much of it belongs to the agent is unknown. A before-and-after comparison can only show that something changed.
That gap between a number moving and knowing what moved it is what experiments exist to close. The method is to run the thing you're testing and its alternative at the same time, on comparable customers or on the same test cases, so that the difference between them has only one cause. What follows is how that works for the support agent, first with customers and then with the engineer's own test runs, and how to avoid the ways it quietly stops working.
Engineering and product experiments
Write the hypothesis down before anything runs
The support agent gets two kinds of experiment, and they differ in what goes into them.
A product experiment puts real customers into groups and asks whether a change served them better. February's question, whether customers who get the agent first have their policy questions resolved more often than customers who go straight to the team, is a product experiment. It needs live traffic and usually weeks of it, and it's judged on the outcome and guardrail metrics M7 agreed, the numbers a head of support cares about.
An engineering experiment runs the system against test cases and asks whether a change to the system made its answers better. Swapping the retrieval step and trimming how much history goes into each call are both engineering experiments, and so is any edit to the prompt. They run on the eval dataset of 200 policy questions with known correct answers, built the way M1 describes, so they take minutes and a few dollars of calls, and no customer sees anything. Most of the experiments an AI engineer runs in a week are usually this kind.
Both kinds start with a hypothesis that's written down before anything runs. A testable hypothesis names the change, the one number that decides it, which is the primary outcome, and how far that number has to move to be worth acting on. It also names a trade-off metric, the number that isn't allowed to get worse while the primary outcome improves. Leave the trade-off out and a change that makes answers better by making them twice as slow reads as a win.
| Engineering experiment | Product experiment | |
|---|---|---|
| Change | v2, which adds a reranker that reorders the retrieved help-center passages and rewrites the prompt | Customers get the agent first on policy questions |
| Compared against | v1, with the same model and the same help-center index | The support team answering on its own |
| Runs on | The 200 eval test cases | Live February traffic, split by customer |
| Primary outcome | Share of answers matching the source article, up at least 2 points | Policy questions resolved within 24 hours, up at least 5 per 100 |
| Trade-off | Median latency up no more than 300 ms | Wrong policy claims at most 5 per 1,000 answers, and every refund mention handed off |
| Decision | Ship v2 if both hold | Ship the agent if both hold |
These numbers are made up, like the company's other numbers. The first half of the module runs the product experiment and the second half runs engineering ones, and the last section covers how a change moves from one kind to the other.
The split
Compare two groups in the same weeks
The fix for February's tangle is to stop comparing this year with last year. Run both ways of handling a ticket over the same weeks, and split customers between them at random.
- Control. The ticket goes straight to the support team, the way it worked before v1.
- Variant. The agent answers policy questions first and hands off the rest.
Random assignment is what makes the two groups comparable. The Saturday Valentine's Day lands on both groups in about the same proportion, and so do the weather that delayed a courier and the marketing email that brought a rush of orders. Whatever is left over between them is the agent.
Assign by customer
A customer who gets the agent on Monday and a person on Wednesday has been in both groups, and their satisfaction score belongs to neither one. Assignment has to stick to the person and stay there for the whole test. Hashing the customer id into a bucket does that, because the same id always lands in the same bucket.
Record the assignment and the version next to the conversation
Every conversation logs which group it was in and which version of the agent answered it, next to the traces from M2. Without that column, February's data can't be split afterwards at all, and without the version, a prompt fix that shipped mid-test would be mixed into the result with nobody knowing.
Keep the split honest once it runs
If the team quietly starts taking over the hard tickets from the agent's group, those tickets have moved between groups, and the comparison is now measuring something other than what you meant.
The primary outcome has to mean the same thing in both groups, and the first of M7's outcome numbers can't be it. The share of policy questions closed without a person is zero in the control group by design, since every control ticket goes to a person, so comparing it across groups measures the setup and says nothing about the agent. The shared outcome is resolution within 24 hours. A policy question counts as resolved when the customer got an answer within 24 hours of writing in and didn't write back about the same question the next day, which is the resolved ticket M7 described. It doesn't matter who answered, so a ticket the agent handed to a person and the person resolved counts too. A wrong answer usually shows up as the customer writing back, which puts it in this number as well.
The other numbers M7 agreed are computed for control and variant separately, from first-reply time through to cost per ticket, and the difference between the groups is the effect of the agent. The share closed without a person is still worth logging in the variant, because it drives the cost per ticket, but it describes the variant alone and has no control value to compare against. A smaller version of the same idea is a holdout, where a slice of traffic stays on the old path indefinitely, so the comparison keeps running after launch and drift shows up as the gap closing.
Not every change can be split this way. A new refund policy applies to everyone at once, and so does a price change. When randomizing is impossible, the fallback is a careful before-and-after that accounts for what else moved, which is weaker evidence and worth labeling as such when presenting it.
Randomization and analysis units
Analyze by the unit you randomized
Assigning by customer settles one question and raises another. The randomization unit is what the coin flip was made for, which in this test is the customer. The analysis unit is what each number is averaged over, and the resolution rate is averaged over conversations. Deng, Knoblich and Lu describe exactly this split in their guide to the delta method, and they note that most user-randomized experiments on Microsoft's experimentation platform carry metrics at both levels, so the mismatch is normal. It causes trouble only when the analysis forgets about it.
Repeated customers are where it shows up. In Valentine's week, a customer whose order is late writes in on Tuesday and three more times before Thursday night. If the agent can't help with that order, the result is four failed conversations with one cause, and they look alike because it's the same person asking about the same flowers. The textbook formula for an interval assumes every conversation is an independent draw, so it counts those four as four separate pieces of evidence, and the interval comes out narrower than the data supports.
Say the variant group's customers opened about 1.5 conversations each, and about 1 customer in 10 wrote three or more times. Treating every conversation as independent gives February's 6-point result an interval of about plus or minus 3.5 points. Computing it so that each customer's conversations move together widens it to plus or minus 5, which is the 1 to 11 reported later in the module, and a result 4 points above zero would go from looking solid to inconclusive. Those numbers are made up, and the effect behind them is real. Anthropic's Evan Miller computed both kinds of error on real evals where questions come in groups, like several questions about one reading passage, and on DROP, a reading-comprehension eval, the grouped standard error came out about three times the naive one (Miller, 2024).
- When the question is about customers, compute the metric per customer. The share of customers whose problem got solved has one number per customer, so the textbook interval works on it.
- When you need a per-conversation metric, compute its interval from customer totals. The delta method in the Microsoft paper does this, and so does a bootstrap that resamples whole customers and never single conversations.
- Size the test in customers. The 1,600 in the next section means 1,600 customers per group, and a customer who writes four times still counts once toward it.
The units can't go the other way round. Assigning each message separately would put the halves of one conversation in different groups, which breaks the comparison the same way the Monday-and-Wednesday customer did.
Sizing the test
Decide the size and the length before you start
An experiment answers a question you have to ask precisely. "Is the agent better" has no answer. "Does getting the agent first resolve at least 5 more policy questions in every 100 within 24 hours" has one, and that number, the smallest difference worth acting on, is what sets everything else.
How much traffic that takes follows from it. A rough sizing rule for a rate like this one is 16 times p times (1 minus p), divided by the difference squared, per group. With a baseline around 50% and a 5-point difference to detect, that lands near 1,600 customers in each group. At February's volume the split reaches that in days. The relationship to notice is that the sample grows with the square of the precision, so halving the difference you want to detect costs about four times the traffic.
Duration has its own rules, separate from sample size. Run whole weeks, because support traffic on a Monday looks nothing like a Saturday, and a test that starts on Wednesday and ends on Tuesday has weighted one Wednesday twice.
Then watch which population you caught while you were running. Valentine's week customers are not February's average customer, so a test run only in that week is measuring the agent under its hardest conditions. That is worth knowing and worth writing on the result.
Looking at the results while the test runs is what quietly breaks experiments. A standard test is built for one look at the end, at a fixed sample size. Checking every morning and stopping the moment the difference looks convincing turns a 5% false-positive rate into something much larger, because each peek is another chance for noise to cross the line.
One way out is to fix the horizon, which means writing down the sample size and the end date up front and then reading the result exactly once. The other is to use a method built for peeking, since sequential and always-valid tests are designed to be monitored continuously, at the cost of needing somewhat more data to reach the same conclusion.
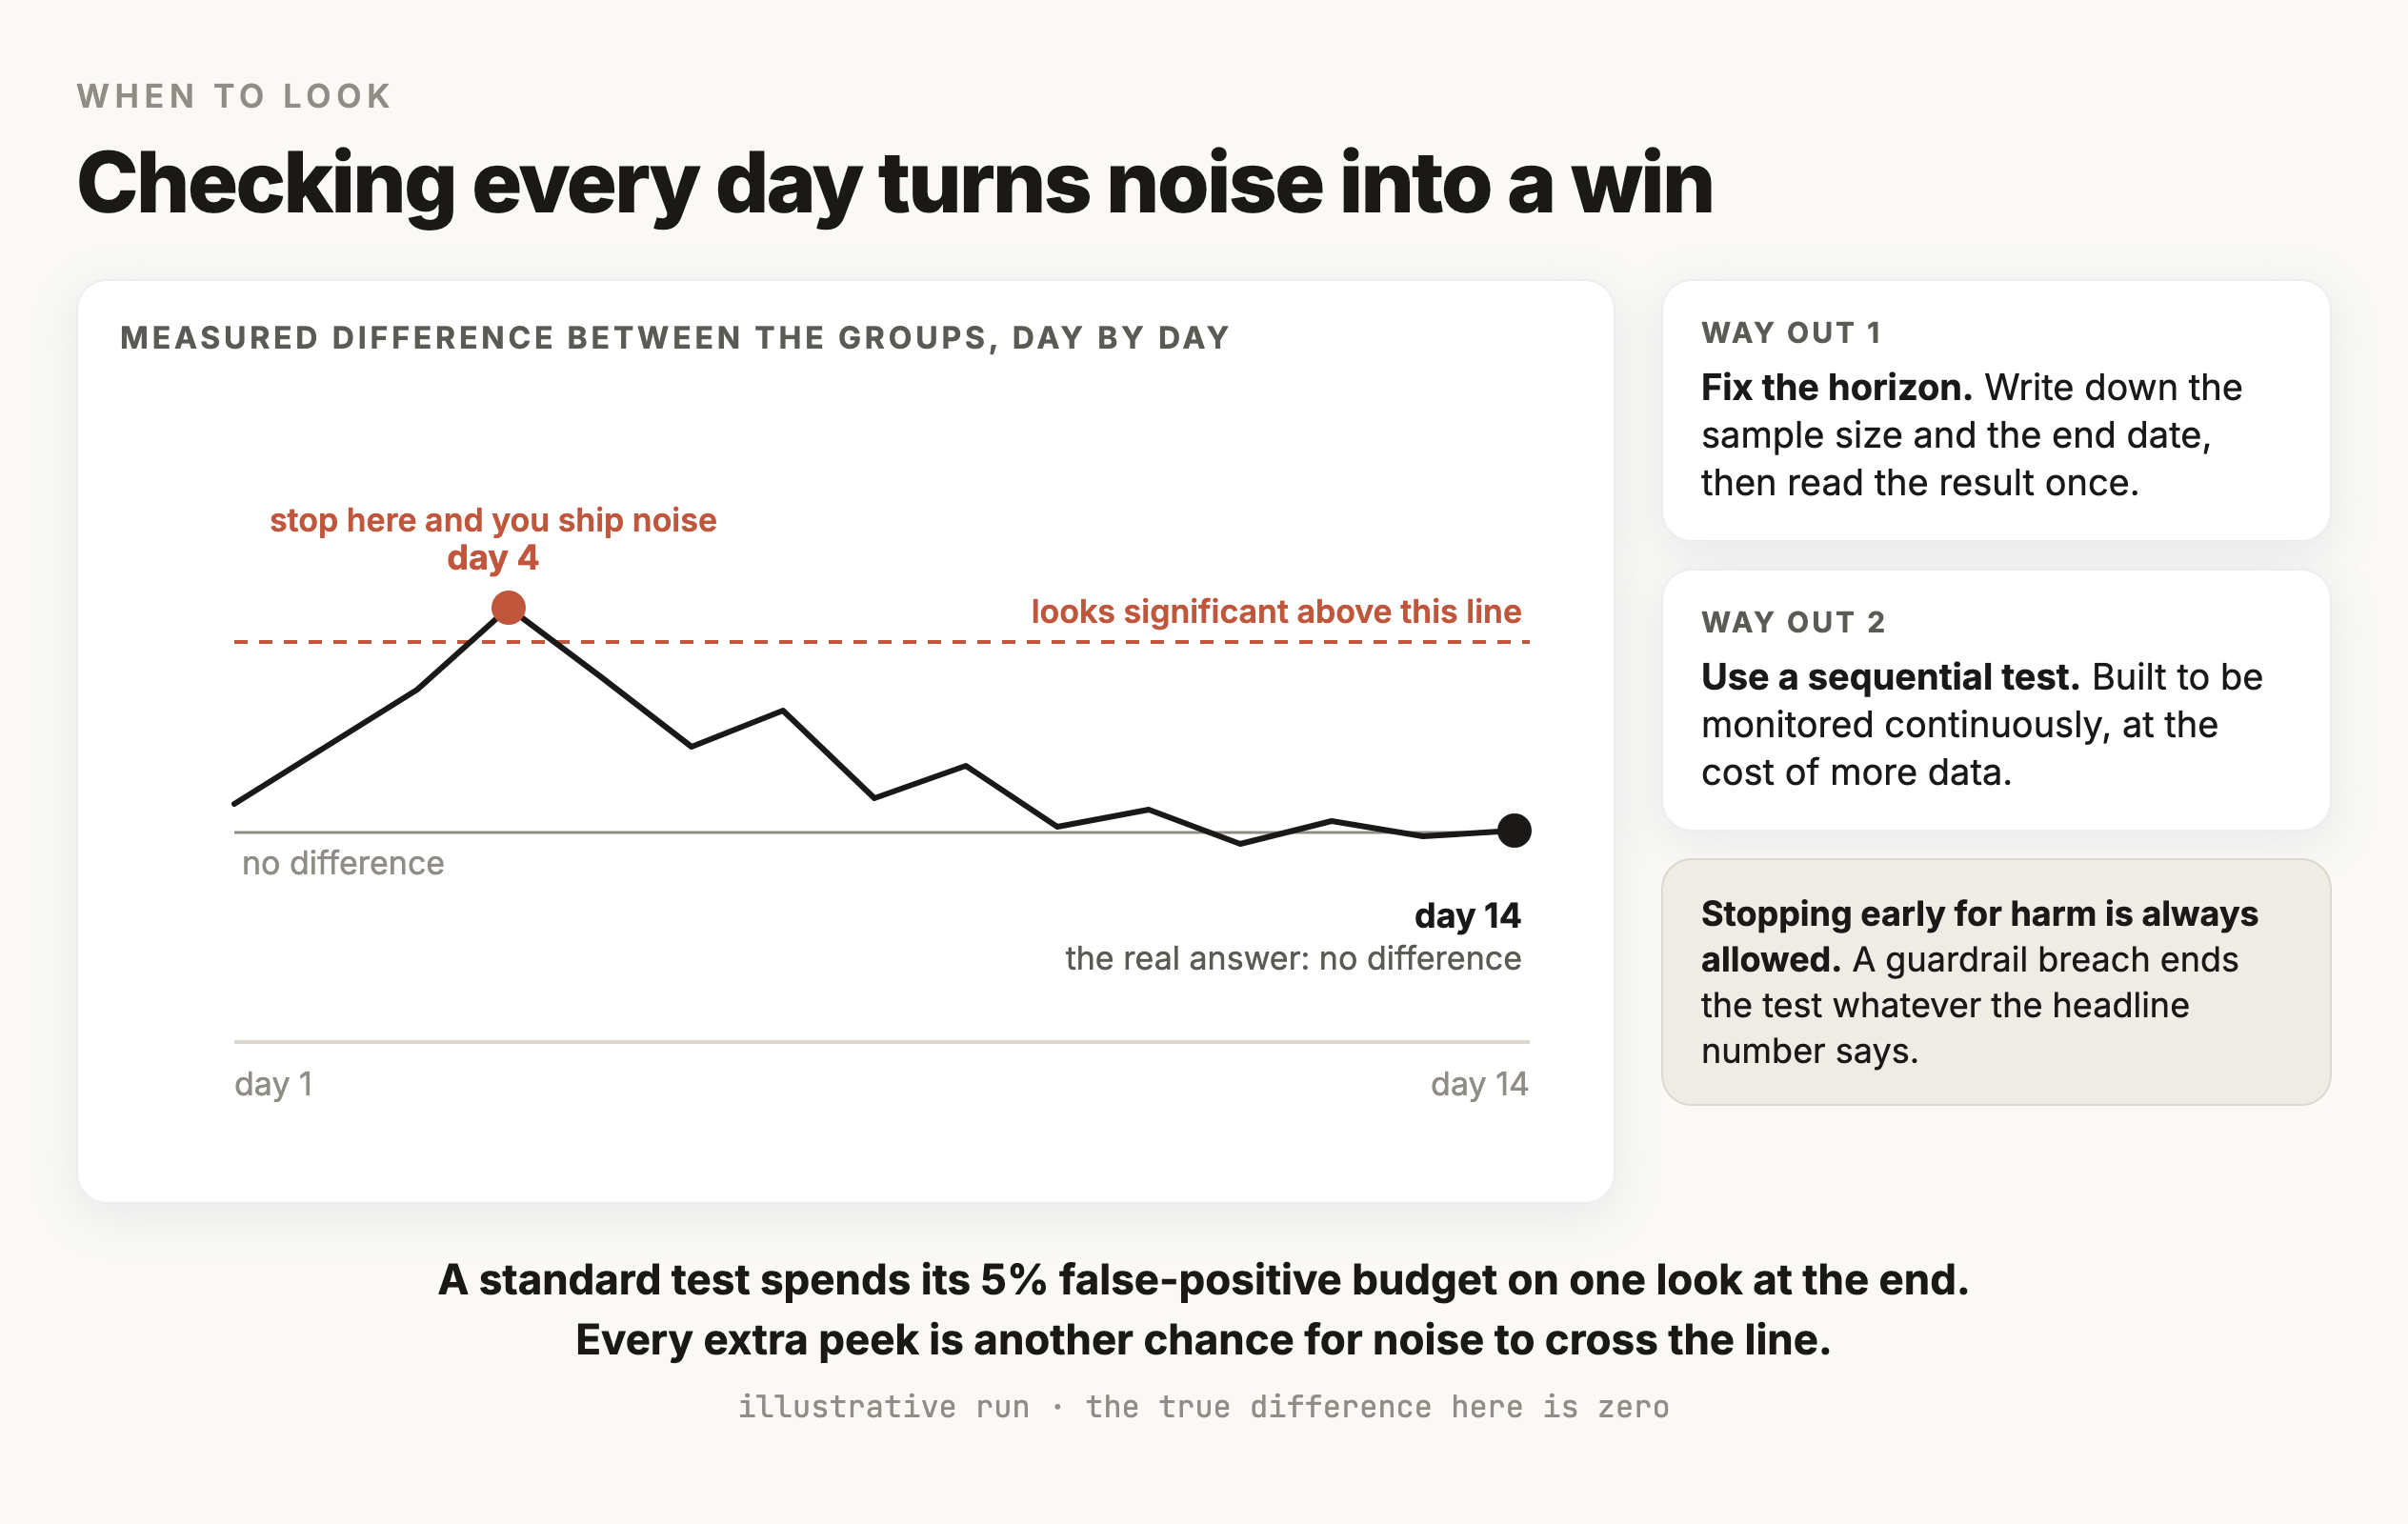
Stopping early for harm is a different matter and always allowed. The guardrails from M7 are watched throughout, and either wrong policy claims or missed handoffs crossing a limit ends the test regardless of how the headline number looks.
All of this belongs on the framing page before the test starts. Agreeing the sample size and the end date is cheap before the test starts, and impossible once the numbers are on the table.
Reading the numbers
Read the result honestly
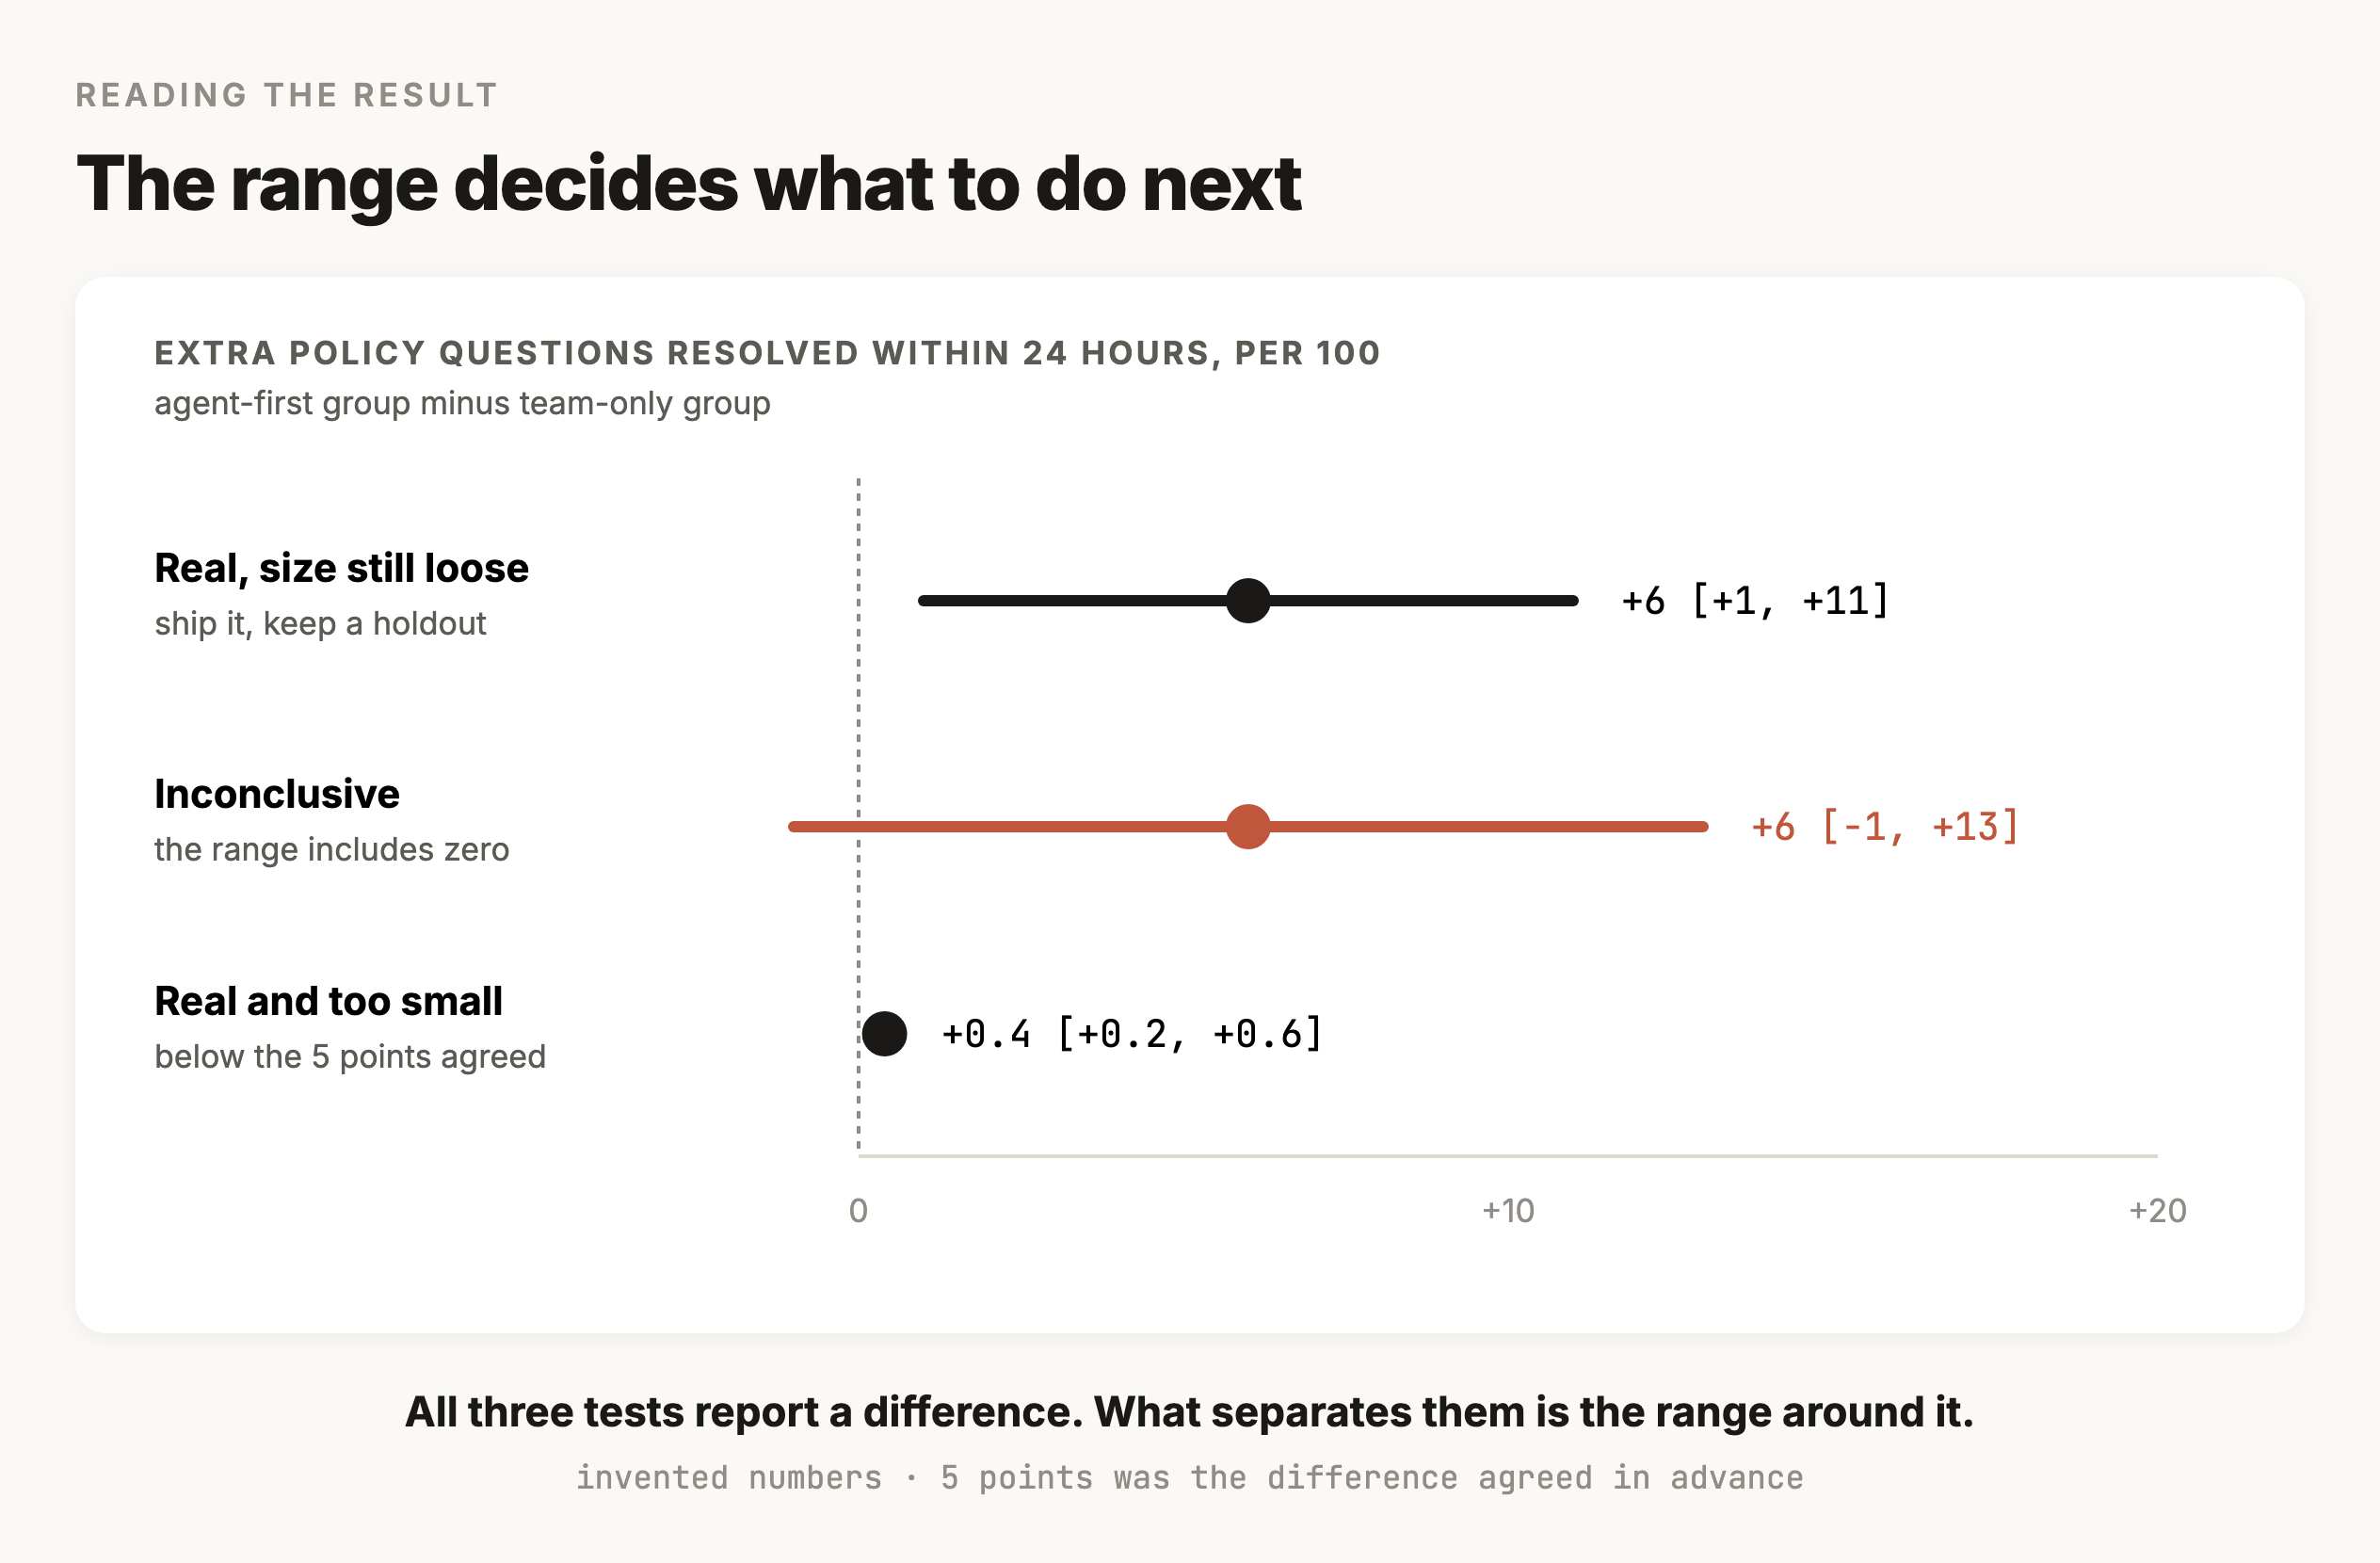
The test ends with a difference between two groups, and that difference comes with uncertainty. Reporting it as "the agent won" throws away the uncertainty, which is what decides the next move. Reported properly it looks like a number with a range around it, say 6 more policy questions resolved within 24 hours per 100, with a 95% interval from 1 to 11. That range says the effect is real and its size is still loosely pinned. An interval from minus 1 to 13 says something different, that the test ran too small to tell.
A win can be too small to act on
With enough traffic a difference of half a point becomes statistically solid and still fails to pay for the eval dataset and the monitoring behind it. The 5-point bar written before the test is what rules it out.
Novelty fades
Customers behave differently in the first days of anything new, in both directions, and plotting the effect week by week is what shows whether it settles or fades.
A guardrail breach fails the test
More questions resolved while wrong policy claims doubled is a failed test, however good that first number looks.
A flat result is also a result, and a common one. If the agent-first group resolves the same share of questions as the team-only group, with quality matched, the experiment has shown the decision is about cost and speed, which is a decision the framing page can already make. A flat result with a wide interval means the test never had the traffic to answer the question. Rerunning it longer is the fix.
Whatever comes out, it gets written next to the ship bar on the framing page from M7. The bar named four thresholds, from 95% of eval answers matching their source article through to a first reply faster than 30 hours. February's result goes beside each line with its interval. The decision to expand to v2 rests on those pairs.
Slices and trade-offs
Read a mixed result slice by slice
February's headline came back at 6 more policy questions resolved within 24 hours per 100, with an interval from 1 to 11, and wrong policy claims came in at about 4 per 1,000 answers, under the limit of 5. That looks like a clean ship. The framing page had also named slices before the test started, which were the three kinds of policy question the agent answers, and broken out by those the result looks different.
| Slice | Share of policy questions | Resolved within 24 hours, agent-first minus team-only, per 100 | Wrong policy claims per 1,000 agent answers |
|---|---|---|---|
| Order-change cutoffs | 50% | +10 (+3 to +17) | 2 |
| Substitutions | 30% | +6 (−2 to +14) | 3 |
| Cancellations | 20% | −5 (−16 to +6) | 11 |
| All policy questions | 100% | +6 (+1 to +11) | 4 |
The ranges in parentheses are 95% intervals, and they get wider as the slices get smaller, because each slice has only its share of the 1,600 customers. The numbers are made up, like the rest of the company's.
Cutoffs carry the win, with an interval well clear of zero. Substitutions point the same way with an interval that includes zero, so the test can't say whether the agent resolves more of them. Cancellations are the problem. Fewer of them were resolved in the agent-first group, though the interval still includes zero, and wrong policy claims run at 11 per 1,000, more than twice the limit, and the all-questions average of 4 hides that completely. The traces from M2 show the cause. The help center has two cancellation articles, one for normal weeks and one for Valentine's week, and the agent quoted the normal-week cutoff during Valentine's week. Customers who acted on that cutoff found their orders couldn't be cancelled and wrote back, so those tickets don't count as resolved, which is why the resolution number and the guardrail point the same way.
A mixed result like this is a trade-off, and the framing page decides it because the guardrail was agreed per answer before the test. The agent ships for cutoffs and substitutions, where it holds the guardrail. Substitutions go with it even though the resolution gain is unproven, because the agent matched the team on quality there and costs 77 cents a ticket against 2.50 dollars, the numbers M7 worked out. Cancellation questions go to the team until the two articles are merged, and cancellations get their own test after that.
Reading slices this way only works for slices named in advance. Three slices named in advance give noise three chances to produce a striking number. A dozen slices chosen after looking at the data will almost always turn up one that looks significant by luck, so a slice found after the fact goes in the findings log as a hypothesis for the next test.
Controlled comparisons
Run both versions on the same test cases, and record every version
The engineering hypothesis from the start of the module was about v2, which adds a reranker to the retrieval step and rewrites the prompt. The tempting way to test it is to run v2 today and put its 97% next to the 96% v1 scored when it shipped in January, which would credit v2 with 1 point. That comparison has February's problem on a small scale. Since January, 20 new and harder test cases went into the eval dataset, and the model alias may have moved to a newer build, which M4 covered, so the gap between the two numbers belongs to several changes at once with v2 only one of them.
A controlled comparison changes only the thing being tested. Both versions run on the same test cases on the same day, with everything outside the change pinned, and a run record says what that everything was.
| Field | v1 run | v2 run |
|---|---|---|
| Code commit | a41c9e2 | 7d03b18 |
| Model | dated snapshot, pinned | same snapshot |
| Prompt | policy-prompt v1.3 | policy-prompt v2.0 |
| Retrieval | help-center index of Jan 28, no reranker | same index, reranker on |
| Eval dataset | eval-v4, 200 test cases | eval-v4 |
| Grader | grader-prompt v2 | grader-prompt v2 |
| Sampling | production settings, 1 run per test case | same |
Only the prompt and retrieval rows differ, and those two rows are v2. When a result surprises someone in May, the record shows what else had moved, and it's the only way to answer that question after the fact. M1 made the same argument for the dataset alone, that a score belongs to one version of the dataset, and the run record extends it to every other part of the system that can change under you.
Running both versions on the same test cases also lets you compare them test case by test case, which M1 called a paired comparison.
| v2 passes | v2 fails | |
|---|---|---|
| v1 passes | 185 | 3 |
| v1 fails | 9 | 3 |
The totals are 188 for v1 and 194 for v2, a gain of 3 points. The table shows where it comes from. v2 fixed 9 test cases and broke 3, and those 3 are worth reading before anything else, because a change that hurts a few questions on the eval will hurt the same kind of question for customers. Computing the interval on the per-test-case differences, which Miller recommends whenever two versions answer the same questions, gives the 3-point gain a 95% interval from about −0.4 to +6.4. Treating the two runs as unrelated would give about −1 to +7. Pairing narrows the range because the two versions mostly agree on which questions are hard, so that shared difficulty cancels out of the difference.
Even paired, one run of each version can't tell a 3-point gain from zero. The next section is about why, and what to do about it.
Repeated runs
Run every test case several times
M4 covered why the same prompt can come back with a different answer on a different run, from sampling at temperatures above zero and from the order GPUs add numbers in even at zero. That variation lands in every eval score. Rerunning v1 twice more with nothing changed scored 188 and then 192, so a 2-point swing came from nothing but sampling. Next to a swing that size, a 3-point gain from one run of each version is hard to trust.
The fix is to run each test case several times and score each one by its pass share, so a test case that passed 4 of 5 runs scores 0.8. The eval score is the average of the 200 per-test-case scores, and its interval is computed across those 200 numbers. Pooling all 1,000 answers and treating them as independent would repeat the repeated-customer mistake, since five answers to the same question are five looks at one question. Miller's paper makes the same point about pooling resampled answers.
Repeats shrink only part of the noise. Some of the uncertainty comes from which 200 questions made it into the dataset, and running them more times can't change that. In the paper's worked example, going from 1 run to 2 cuts the variance of the score by a third and 4 runs cut it by half, and the gains flatten after that. More test cases is the only fix for the rest.
With 5 runs per test case, v1 scores 94.2% and v2 scores 97.1%, a paired difference of +2.9 points with a 95% interval from +0.6 to +5.2. The interval clears zero, so the gain is real. The estimate is above the 2-point bar, though the gain could be as small as 0.6 points, and median latency rose by 180 ms, inside the 300 ms trade-off. v2 ships. The runs cost about 20 dollars, which is 2,000 answers at the roughly 1 cent per answer M7 worked out, plus the grader's calls.
The repeats also show which test cases are unstable. Under v2, 14 of the 200 passed somewhere between 1 and 4 of their 5 runs. Those are the questions where the answer depends on the sample, and reading them usually turns up an ambiguous article or two passages the retriever can't choose between. With one run each, those 14 would have come out as passes or fails at random.
Setting the temperature to zero so that runs repeat is tempting, and the paper advises against it unless zero is what production uses. It changes the behavior you're measuring, and the paper shows it can move the variation into the per-question scores, where repeats can no longer reduce it.
Ablations
Remove one change at a time to see which one moved the score
v2 bundled three changes. The reranker was one. The rewritten prompt held the other two, which were four worked example answers and a rule telling the agent to quote the cutoff time word for word from the article, aimed at the 24-versus-48-hours mistake M7 described. The comparison above says v2 as a whole is better. It can't say which change did it, and each change has a cost to keep. The examples alone add 850 tokens to every call.
An ablation answers it. You run the full version, then the full version with one change removed, once for each change, all with the same run record and 5 runs per test case.
| Version | Match rate | Difference from full v2 (95% interval) | Input tokens per answer |
|---|---|---|---|
| Full v2 | 97.1% | 3,900 | |
| Without the reranker | 94.6% | −2.5 (−4.6 to −0.4) | 3,900 |
| Without the worked examples | 97.0% | −0.1 (−1.6 to +1.4) | 3,050 |
| Without the cutoff rule | 96.3% | −0.8 (−2.5 to +0.9) | 3,850 |
| v1, none of the three | 94.2% | −2.9 (−5.2 to −0.6) | 3,000 |
The reranker accounts for most of the gain, since removing it takes away 2.5 of the 2.9 points. Removing the worked examples changes nothing measurable, and they're 850 of the 900 tokens v2 added, so they come out. That's a negative result, and a useful one, because M5 showed that tokens the model doesn't need can cost accuracy as well as money. The cutoff rule's interval includes zero, and the eval dataset has only a handful of cutoff-time questions, so this run can't measure it. It stays because it costs 50 tokens and targets a failure customers have already seen, and the findings log says its effect is unmeasured.
The three differences add up to 3.4 points, more than the 2.9 the whole bundle gained. Changes interact, and here the cutoff rule can only quote an article the reranker put in front of the model. That's why this ablation removes each change from the full version, which measures what each one contributes given the others. Adding the changes to v1 one at a time would give different numbers that depend on the order you added them in.
Exercise · context strategy
Exercise: test a cheaper context strategy
In March someone proposes cutting the cost of long conversations. v2 resends the whole conversation on every turn, the list M3 described. The proposal is a sliding window, one of the compaction methods from M5, which keeps the system prompt and the last 6 turns and drops everything older. It's cheaper on long conversations, and M5 already says what it can lose, which is anything the customer said early. Your job is to find out whether that loss hurts this agent's answers, and how much the window saves. The numbers in this exercise are made up.
- 01Write the hypothesis. The change is the last-6-turns window, compared against the full history. The primary outcome is input tokens per conversation, down at least 25%. The trade-off is the match rate, down no more than 1 point once it's weighted by February's traffic.
- 02Build the test cases. The 200 eval test cases are single questions, so they can't show this failure. Pull 60 multi-turn conversations from February's traces and label each one with the correct final answer and the turn where the fact that answer needs first appeared. Include long conversations where the order number or the delivery date shows up only in the first turn or two.
- 03Run both strategies on all 60, 5 times each, with a run record like the one above.
- 04Slice by conversation length and by where the needed fact sits, and weight each slice by its share of February's conversations.
- 05Write the finding, including when it says no.
Write a Python script context_ab.py that compares two context strategies for our support agent on multi-turn test cases.
Input is long_convos.jsonl, one test case per line, with messages (the conversation up to the final customer turn), expected (the correct final answer) and fact_turn (the turn where the fact the answer needs first appears).
Strategy A sends the full messages list. Strategy B sends the system prompt plus the last 6 turns. Everything else stays identical and comes from run_config.yaml: the pinned model id, the prompt file, retrieval settings and the grader. Write that config and the current git commit into the output file.
Run each test case 5 times per strategy and grade every answer with our existing grader. For each test case, record the pass share and the total input tokens for each strategy.
Report the paired difference in pass share with a 95% interval computed across test cases, averaging each test case's 5 runs first. Report the change in input tokens. Then report both numbers for each of three slices. Slice 1 is 6 turns or fewer. Slice 2 is longer, with fact_turn inside the last 6 turns. Slice 3 is longer, with fact_turn outside them. Finish with the overall numbers weighted by the slice shares in traffic_shares.json.
Before running anything, you can predict one slice. When the fact the answer needs sits outside the last 6 turns, strategy B never sends it, so the model has to guess or ask the customer again. The run measures how often that happens and how much it moves the overall number.
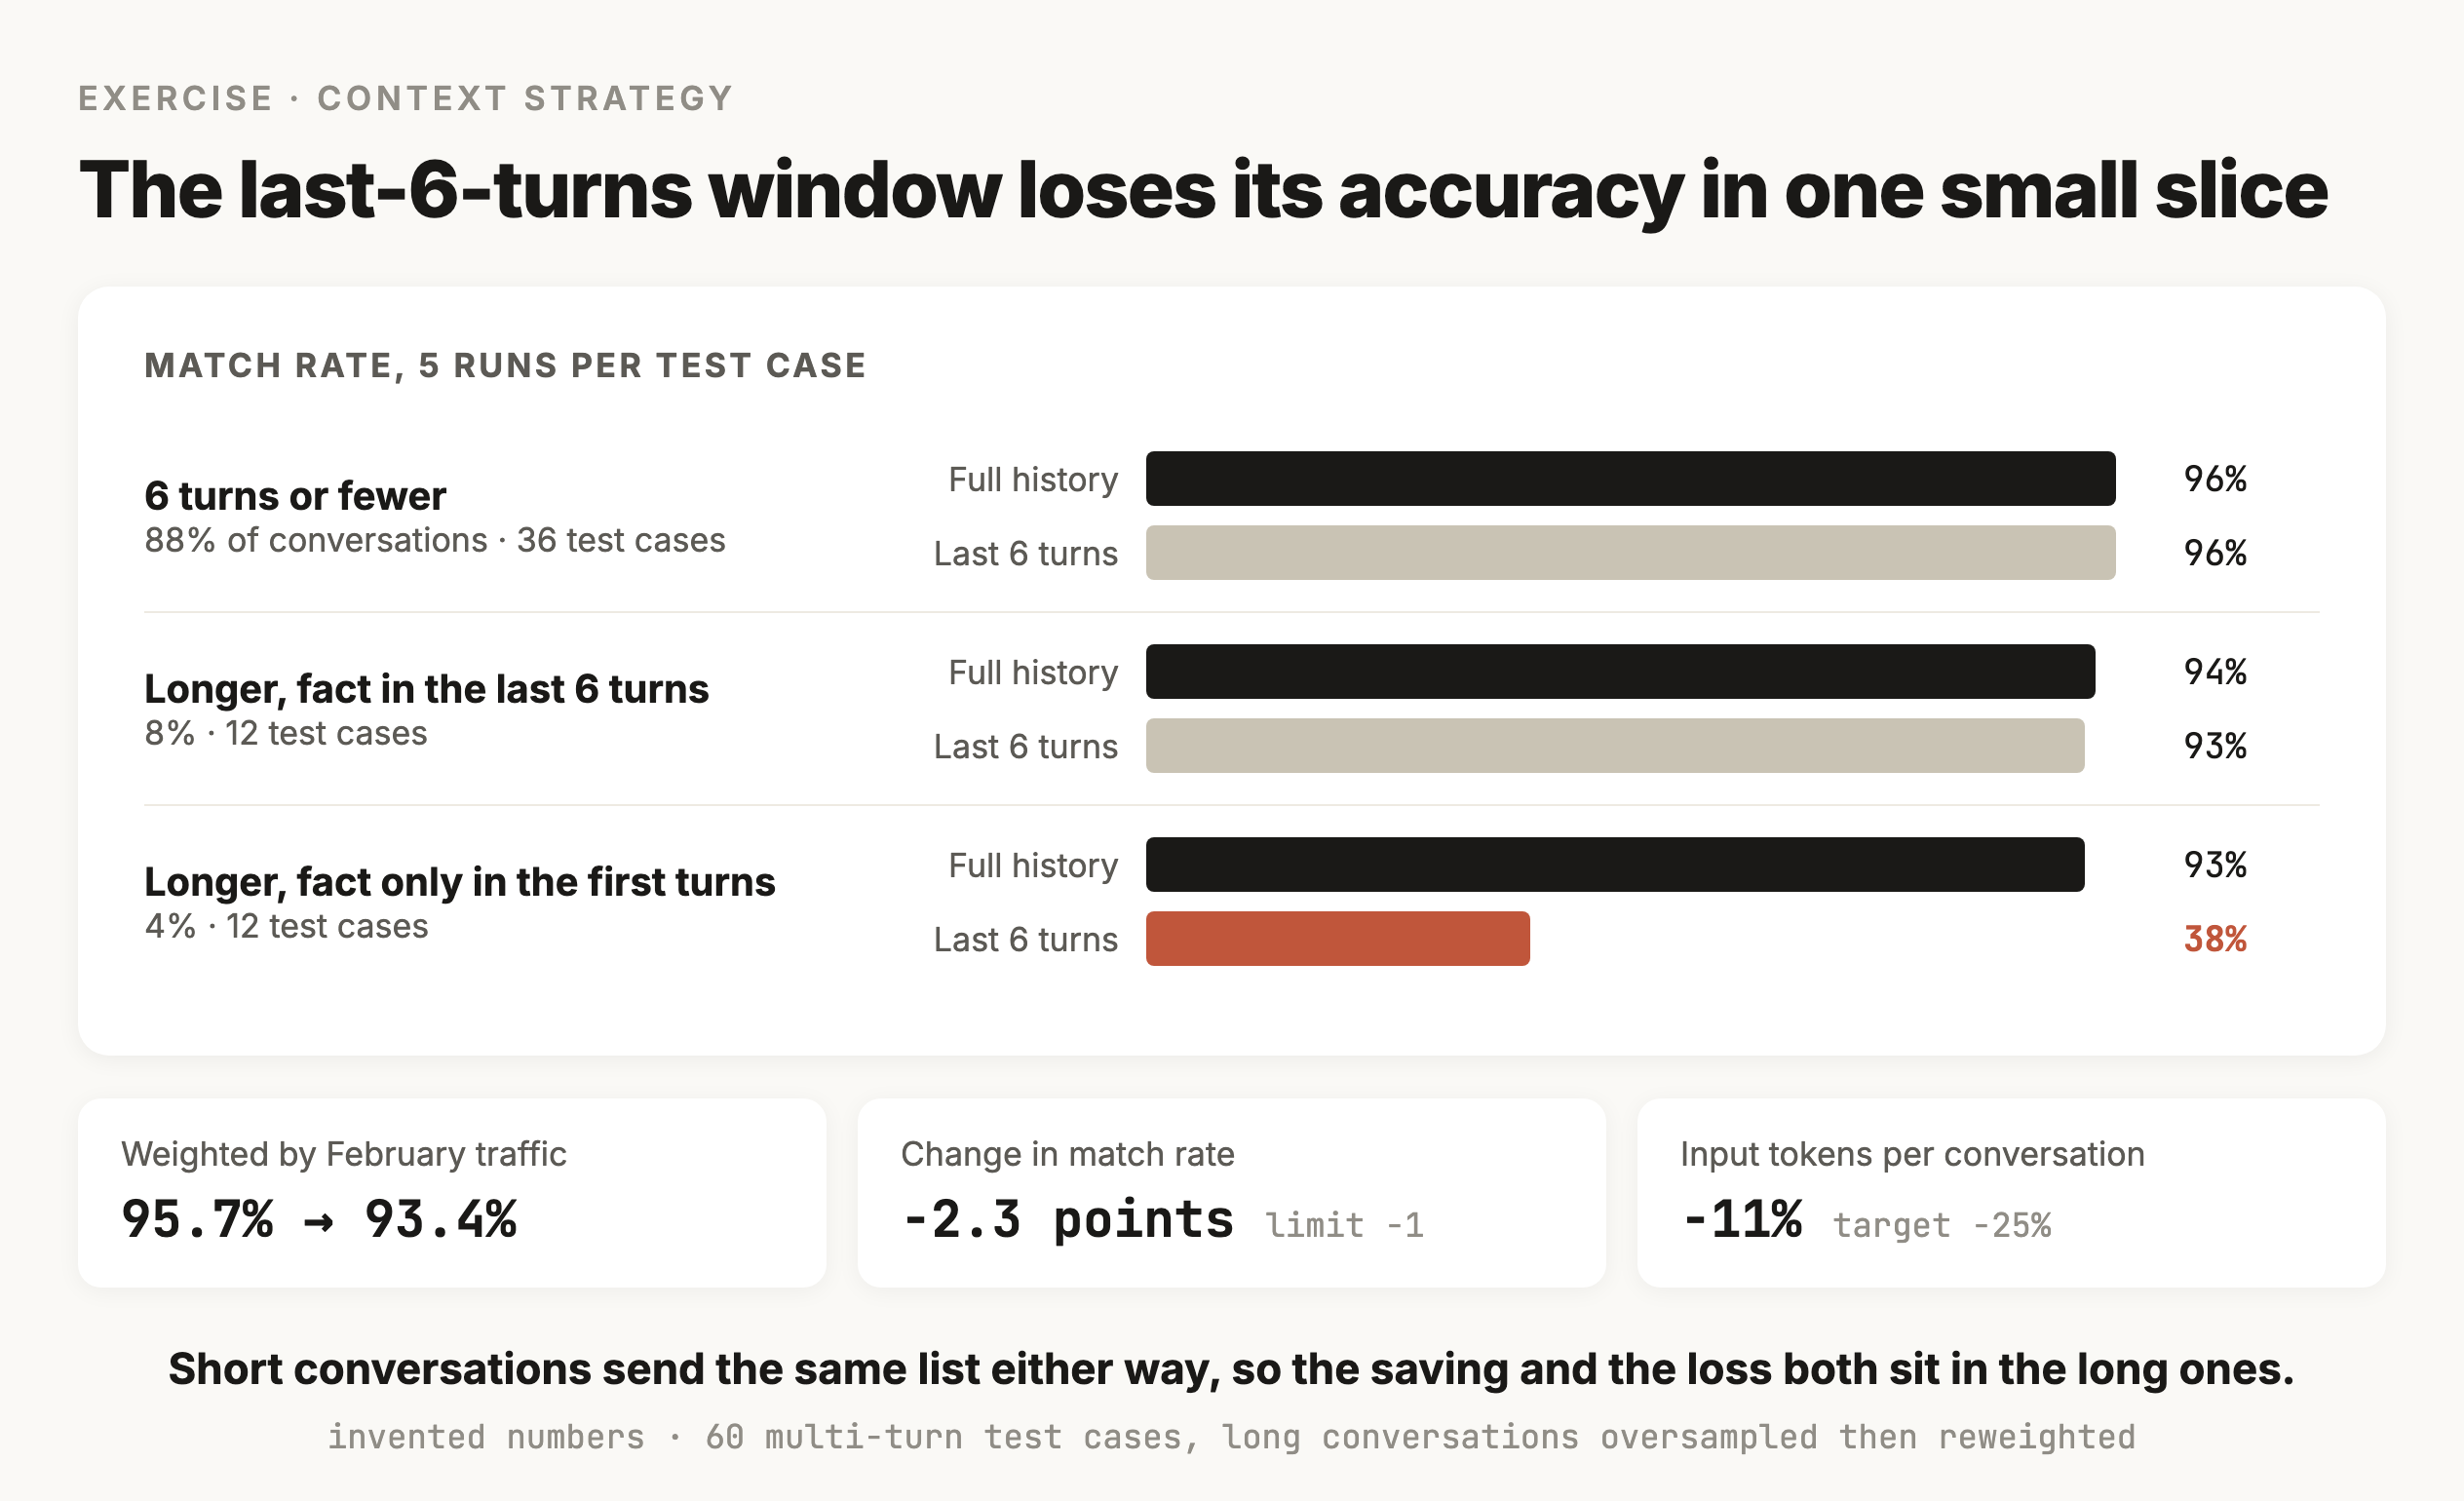
| Slice | Share of February conversations | Test cases | Full history | Last 6 turns | Difference |
|---|---|---|---|---|---|
| 6 turns or fewer | 88% | 36 | 96% | 96% | 0 |
| Longer, fact in the last 6 turns | 8% | 12 | 94% | 93% | −1 |
| Longer, fact only in the first turns | 4% | 12 | 93% | 38% | −55 |
| Weighted by February traffic | 100% | 60 | 95.7% | 93.4% | −2.3 |
The hypothesis fails on both of its numbers. Input tokens per conversation fell 11%, short of the 25% target, because 88% of conversations never pass 6 turns and send the same list under either strategy. And the weighted match rate fell 2.3 points against an allowance of 1.
The test cases oversample long conversations on purpose, 24 of the 60 against 12% of traffic, because that's where the two strategies can differ. That's why the weighting step is there. Averaging the 60 test cases without weights would report a drop of about 11 points, which overstates what customers would see. So the decision uses the weighted number, and the slice explains where the loss comes from. For 4% of conversations, customers who gave their order number at the start would be asked for it again, or get an answer about the wrong order.
The finding is a negative one. The window is rejected, and the next hypothesis to test is a window that also keeps a short block of facts pulled from early turns, like the order number and the delivery date, which is the kind of summary M5 said keeps a detail only when the instruction names it.
Findings
Write down every finding, including the ones that didn't work
Each experiment ends in a finding, a short entry that records the hypothesis, the result with its interval and the decision. The versions live in the run record the entry points to. Findings go in one log the whole team reads, next to the framing page from M7.
| Test | Hypothesis | Result | Decision |
|---|---|---|---|
| Feb, product split | Agent-first resolves 5 or more extra policy questions per 100 within 24 hours, guardrails hold | +6 per 100 (+1 to +11). Cancellations at 11 wrong claims per 1,000 | Ship for cutoffs and substitutions, cancellations stay with the team |
| Mar, v2 against v1 | Match rate up 2 points or more, latency up 300 ms or less | +2.9 points (+0.6 to +5.2), latency +180 ms | Ship v2 |
| Mar, v2 ablation | Each of v2's changes adds to the match rate | Reranker −2.5 when removed. Examples −0.1 (−1.6 to +1.4). Cutoff rule unmeasured | Remove the worked examples |
| Mar, last 6 turns | Tokens down 25% or more, match rate down 1 point or less | Tokens −11%. Match rate −2.3 weighted, −55 when the fact was early | Rejected. Test a facts block next |
Two of the four entries are negative results. Those are the ones most likely to get lost, because nobody presents the idea that didn't work, and the cost of losing them shows up months later when someone new proposes trimming the history to save money and reruns the same test. A negative finding tied to its run record says what was tried under which conditions, so a rerun is worth doing only when something in the record has changed, like a new model that handles long input differently. A flat result from a product test goes in the same way, with its interval, so the next reader can tell a real no-difference from a test that was too small.
The log is also what an interviewer is asking about when they say "tell me about an experiment that failed." An entry with its run record and the slice that explains the result is a complete answer to that question.
From test cases to traffic
Move a change from the eval dataset to customers in steps
The two kinds of experiment form a pipeline. A prompt change is checked against the eval dataset first, because a change that drops from 95% to 88% on known answers never deserves the traffic. What survives that goes out to a slice of customers, where the effect on real behavior gets measured. The eval dataset catches regressions cheaply, and the product experiment is what turns a quality number into a claim about the business, like whether the customer came back the next day.
Shadow mode runs the new version where nobody sees its answers
The agent generates an answer for real tickets while the support team keeps replying, and nobody sends the agent's version. Comparing the two shows how the agent behaves on live tickets with no customer exposure, which is the cheapest way to catch the questions the eval dataset never imagined.
A canary gives the new version a small share of traffic
The agent handles a small share of traffic, say 5%, with the guardrails watched closely. It keeps a bad deploy to a small number of customers, and it's the usual step before a split test runs at full size.
Putting it together
Putting it together
February produced a number, and the module was about earning the right to explain it. Four changes shipped in the same weeks, so the before-and-after could only say that something improved. Splitting customers at random between the agent and the old path put every seasonal effect on both sides of the comparison, which left the agent as the one difference between them.
The product experiment then needed its discipline written down before it ran. The hypothesis named a primary outcome with the smallest difference worth acting on, and a trade-off that couldn't get worse. The sample size followed from that difference, counted in customers because customers were what got randomized, and the interval had to treat one customer's conversations as moving together. The result came back with a range, and reading it by the slices named in advance turned a clean-looking win into a decision to ship for two kinds of question and hold back the third.
The engineering experiments used the same reasoning on test cases. Both versions ran on the same test cases with a run record pinning everything else, and the paired difference said more than the two totals did. Five runs per test case separated a 3-point gain from sampling noise, and an ablation showed which of v2's changes produced it. The context-strategy test showed the cheaper window losing early facts in exactly the slice the mechanism predicted. The findings log keeps all of it, including the two results that said no, so nobody pays for the same test twice.
M11 picks up how a canary is read once releases are routine, M12 uses the same comparisons to judge cheaper models on cost per resolved ticket, and M21 uses them to decide whether a fine-tuned model beats the one you have.
Checkpoint · recall · 5 questions
What the module said
- 01
Why can't February's before-and-after comparison credit the agent?
- 02
In a split test, what should the assignment be keyed to?
- 03
What does the smallest difference worth acting on determine?
- 04
What does a shadow-mode run do?
- 05
Each of the 200 test cases runs 5 times. How should the eval's interval be computed?
0 / 5 answered
Checkpoint · understanding · 5 questions
Reason it through
- 01
A test is set to run two weeks. On day 4 the variant is ahead and the result looks significant. Why is stopping now a problem?
- 02
A test reports 6 more questions resolved per 100, with a range from minus 1 to plus 13. What does that support?
- 03
The agent-first group resolves 3 more questions per 100, and wrong policy claims doubled during the same test. What does the result say?
- 04
The variant's 2,400 conversations came from 1,600 customers, and some wrote four times about one late order. The analyst computes the interval as if every conversation were independent. What happens?
- 05
Removing v2's worked examples changes the match rate by −0.1 points, with an interval from −1.6 to +1.4. They add 850 tokens per call. What does that support?
0 / 5 answered
Checkpoint · debugging · 4 questions
Debug it
- 01
Halfway through the test, the support team starts pulling the hardest tickets out of the agent's queue to protect customers. What does that do to the result?
- 02
Analysis time, and nobody can tell which conversations were in which group. What was missed at setup?
- 03
A new prompt scores 96% today. The old prompt scored 92% in January, so the team credits the new one with 4 points. Rerun today with 5 runs per test case, the old prompt scores 95.5%. What went wrong?
- 04
A teammate ships the last-6-turns window to save cost. A customer gives their order number in the first message, and by the ninth turn the agent asks for it again. What's going on?
0 / 4 answered
Go deeper
Kohavi, Tang & Xu: Trustworthy Online Controlled Experiments · Miller (Anthropic, 2024): Adding Error Bars to Evals · Deng, Knoblich & Lu (Microsoft, 2018): Applying the Delta Method in Metric Analytics
That's the last one written so far
Pick your next module from the board.