
The capability
What production engineering for a model call is
Production engineering for an AI feature is the work of keeping it fast and reliable once a lot of people are using it at the same time. Most of that work is about the model call, because it's the slowest and least predictable thing your app depends on.
Most teams start by calling a hosted model like GPT, Claude or Gemini through their respective API. A model call can take anywhere from a few seconds to hours. Now you might be asking, why is that important? Well, because your usage is capped in tokens per minute, and every part of your app that uses the same API key shares that one cap. On top of that, the frontier labs update their models and have outages on their own schedule, so you often find out something changed at the same moment your customers do. Now, if you host an open model on your own GPUs, you won't have to deal with the lab's limits and outages, but you take on the same problems yourself. The cap becomes how many requests your GPUs can serve at once, and when the server goes down, fixing it is your job, which section 7 covers.
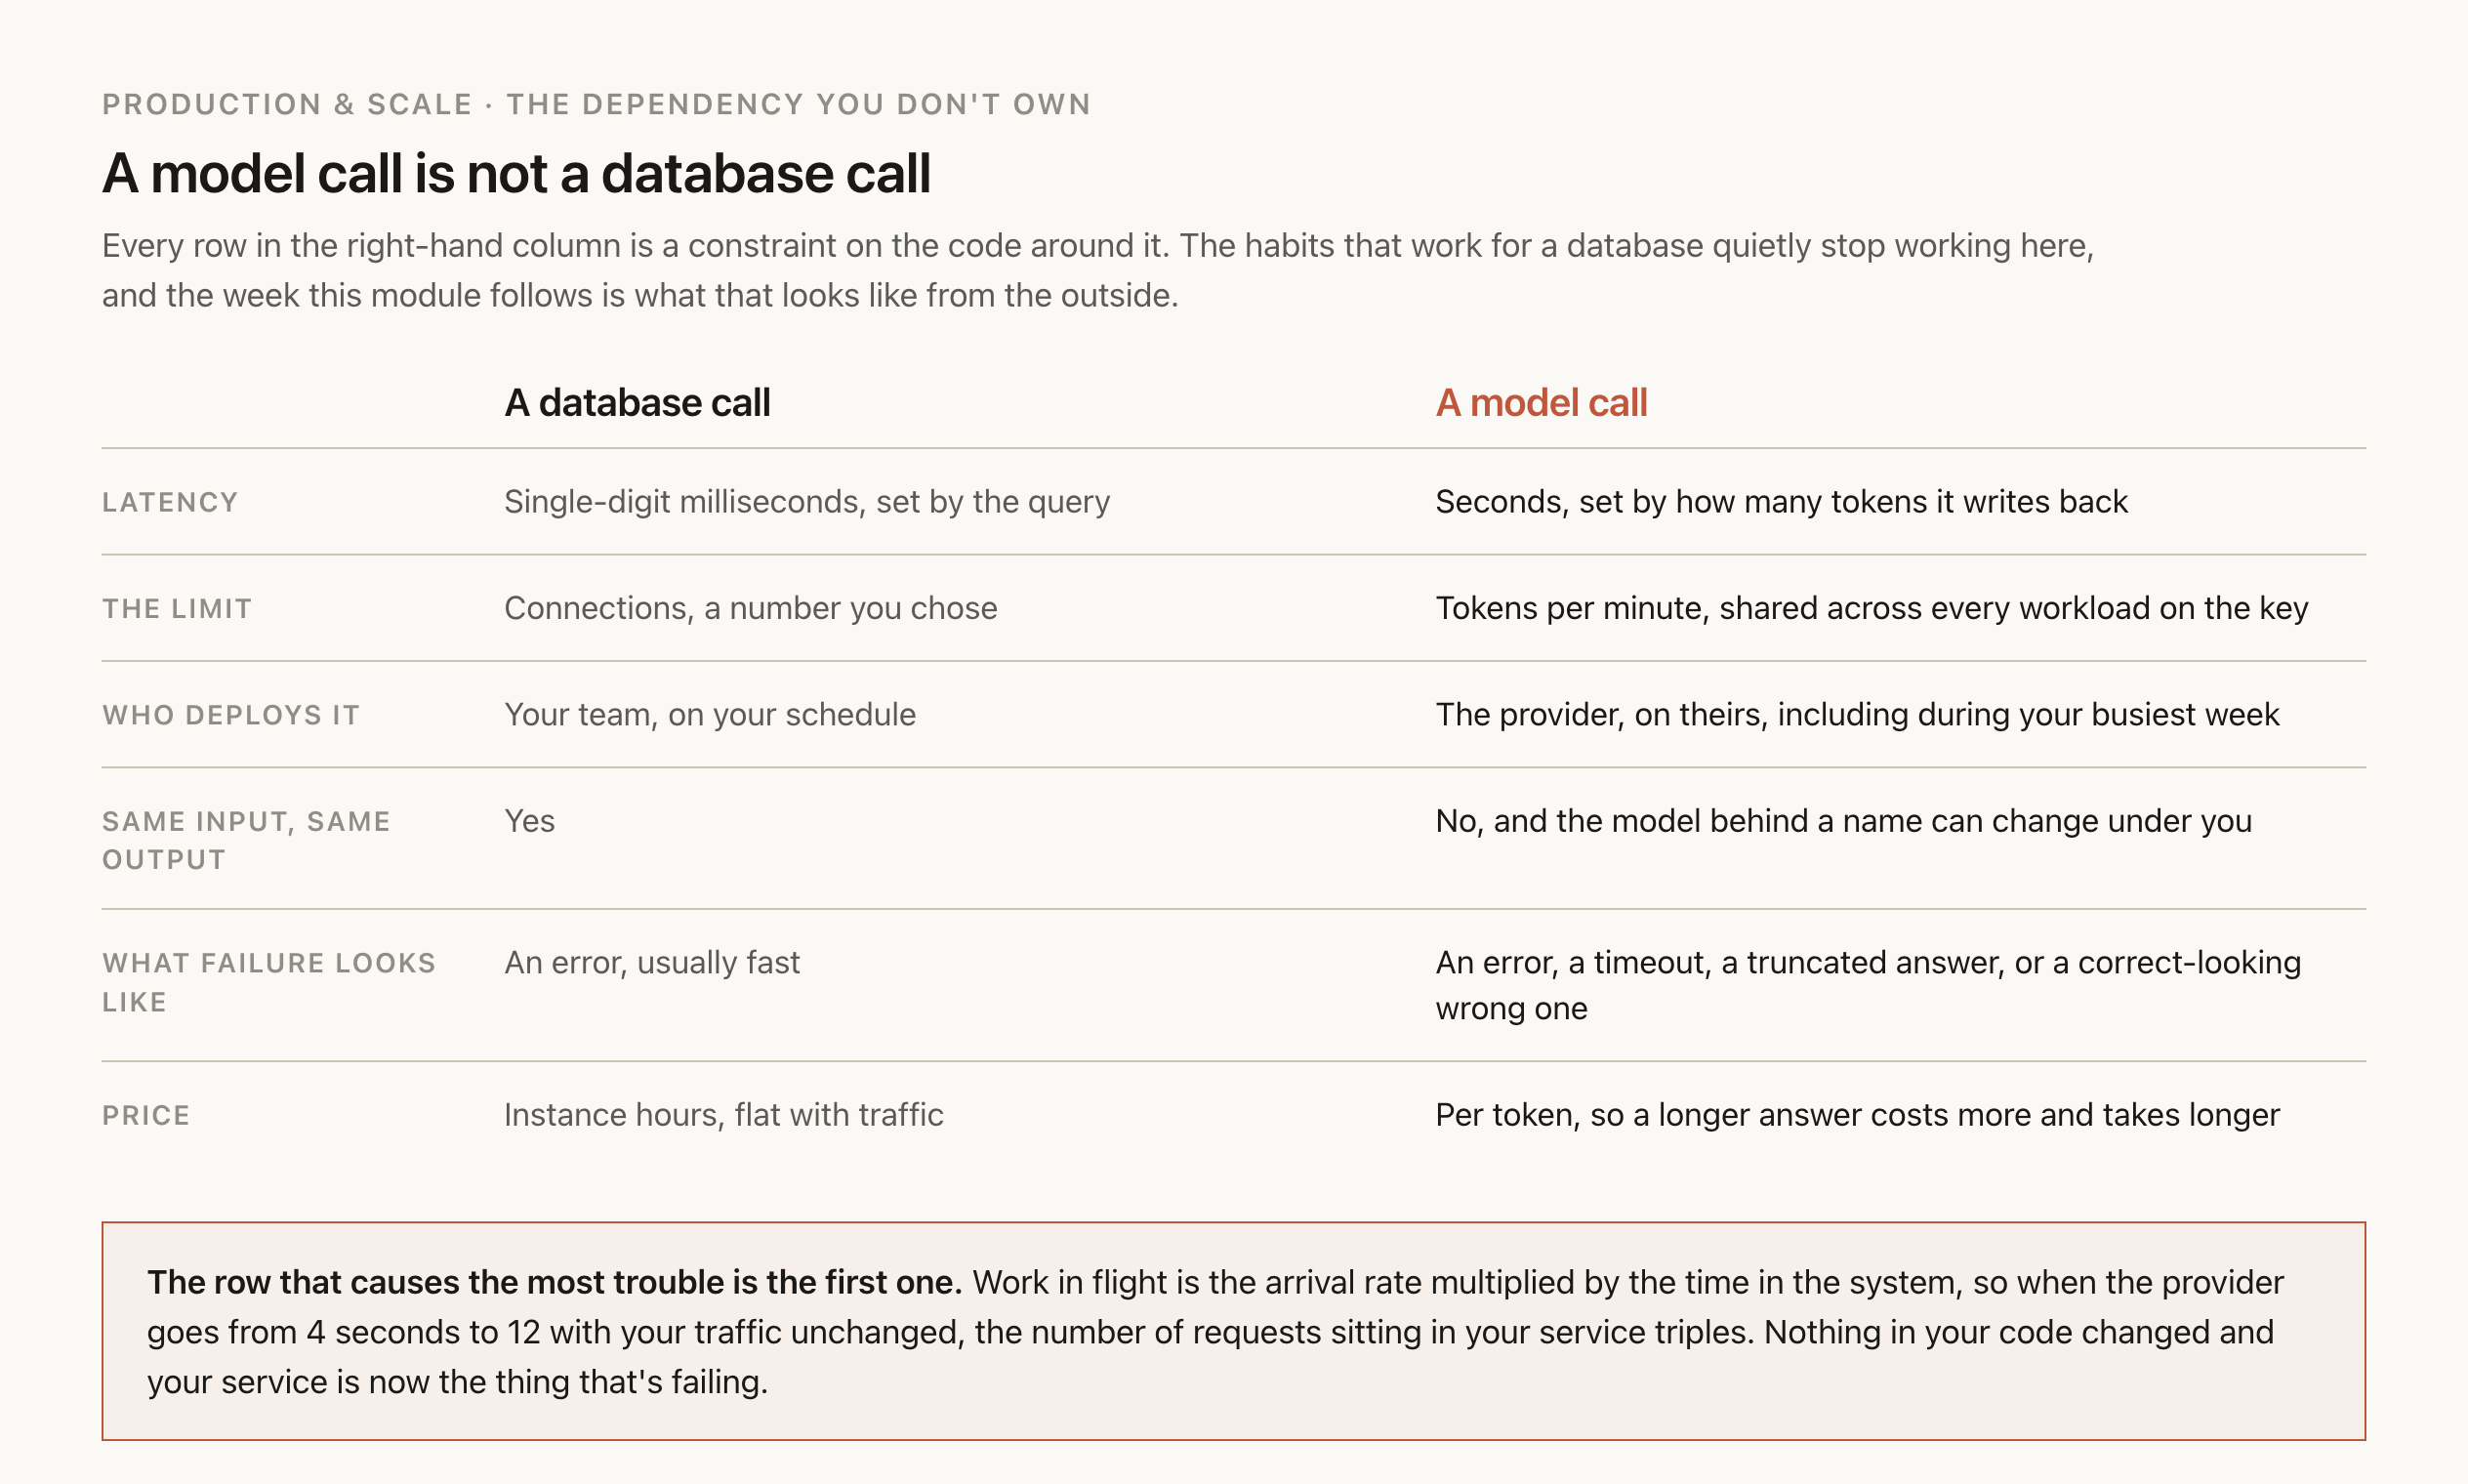
You can't always make the model call faster (unless you play around with reasoning and token caps), but you can work out ahead of time how much it will pile up inside your app. The number of calls in progress at any moment is how many start per second times how long each one takes. At about 2 calls a second and 4 seconds a call, around 9 are in progress at once. If the provider slows to 12 seconds a call, 27 are in progress, three times as many, even though your traffic didn't change at all. Every one of them holds a connection and a worker slot while it waits, so once those run out, new users get errors, and a slowdown at the provider becomes an outage in your app. Section 5 works through it with the numbers from section 2.
Each request also needs the right path, and that depends on who's waiting for the answer. Someone watching a chat window needs the answer streaming back within a couple of seconds, while a nightly job can sit in a queue for hours. If both go down the same path, a big batch job can use up the token cap and leave the chat feature with nothing, which section 4 covers.
So what's left for you to control is how many calls you let run at once, how long each one gets before you give up on it, where work waits when there's too much of it, and what happens when the provider slows down or stops. Part 2 covers the other half of production, which is knowing what's deployed and being able to roll it back.
Where it shows up
Pretty much any product where a model call sits between a request and a response runs into this. What it looks like depends on who's waiting on the other end.
In a chat feature somebody is watching the screen, so the arrangement is streaming and the budget is a couple of seconds to the first token. A nightly batch job is the opposite case, since nobody is waiting at all, which means the work can go in a queue and the budget is the whole night. A webhook handler sits somewhere awkward in between, because it has to answer a third party inside three seconds while the model takes eight, so the work has to move somewhere else and the handler has to answer without it. And an internal tool at low volume looks like none of these until the day its volume changes.
In all four, you end up asking the same questions. How long does one call take? Which limit do you hit first? How many calls can run at once? And what happens when an answer comes back late?
Where this starts
The week the agent stopped answering
M9 followed the flower company's support agent through Valentine's week from inside the code, where each failed model call got retried, repaired or handed to a person. This module is the same week from the outside, where the questions are how many requests were in flight, which limit the traffic hit first, and what was deployed at the time. The company is made up, and so are its numbers.
To give you a sense of the load, the agent handles about 60,000 conversations in February, and the busiest hour of the 13th carries about 1,152 of them, roughly 35 times an average hour in a normal week. Each conversation runs about 4.8 turns, and a turn that uses a tool makes two model calls, one that asks for the tool and one that answers with the result. That comes to about 2.2 model calls a second at the peak, against 0.3 on a normal busy afternoon.
Five things went wrong that week, and none of them was a bug in the agent's code.
First, traffic ramped up for three days, and nothing broke. More requests were in progress at once as traffic grew, and the web servers handled it, because they'd been sized during last year's split test.
Then the provider slowed down on the evening of the 12th, and calls that had been taking about 4 seconds started taking 12. M9 already covered what the harness did with each of those calls. From the service's side it looked different, and worse, because three times as many requests were sitting in memory even though traffic hadn't changed at all.
At 2 a.m. the nightly summarization job made chat start failing. That job summarizes closed tickets and shares an API key with the chat path, so the two of them were spending the same rate limit and the batch work got there first.
On Tuesday somebody changed a prompt and answers got worse, and nobody could say which version had been live at 10:02.
Then the provider had an incident on the 13th, and the traffic that moved over to the fallback model hit a different limit within a minute of arriving.
The first three are load problems, which is what this part deals with. The last two come from changes, and Part 2 picks those up.
When you build an agent on your laptop, you're sending one request at a time. There's no queue, you never get near a rate limit, and there's only one version of everything. Everything in the rest of this module is there because one of those stopped being true during that week.
The mental model
A model call is slow and metered, and it can change without you touching it
Most of what failed that week came from treating the model call like a database read. As you saw in M6, a read from a database in the same data center takes a few milliseconds, "which is small next to the model call." Latency is only one of the differences, though, and each of the others shapes some part of the design in both halves of this module.
| A Postgres read | A model call | |
|---|---|---|
| Time | A few milliseconds | Seconds, and it varies per call |
| What sets the time | Index and row size | Output tokens, mostly |
| Capacity | Connections and CPU you provision | Requests and tokens per minute, set by the provider |
| Shared with | Your own services | Every feature using the same key or project |
| Cost per call | Electricity | Metered per token, including every retry |
| Versions | You upgrade when you choose | The provider changes models and retires them |
| Failure | An error, or a slow query | An error, or a fluent answer that's wrong |
Latency is set by how many tokens come back
When you send a request, the first token takes a moment to arrive, because the provider has to queue it, read your input and send the answer back over the network. After that, tokens come out at a fairly steady rate, so the total time mostly depends on how many tokens the model writes. Databricks measured this on its own models and put the ratio plainly, that "The addition of 512 input tokens increases latency less than the production of 8 additional output tokens" (Databricks).
So in practice, trimming the prompt saves money and rate-limit budget but barely moves latency, while cutting the length of the answers, or the reasoning effort behind them, moves it a lot. M5 covered what to put in the context, and this is the operational reason to care about the size of what comes out.
Limits are tokens per minute, shared across everything on the key
Every provider caps how many requests and tokens you can send per minute, for each organization and project. The catch is that they count tokens differently, and the difference is big enough to change your capacity plan. As of September 2026:
- OpenAI says "Your rate limit is calculated as the maximum of
max_tokensand the estimated number of tokens based on the character count of your request" (OpenAI, rate limits). A generousmax_tokensspends limit the request never uses. - Anthropic counts input and output separately, and "For most Claude models, only uncached input tokens count toward your ITPM rate limits." Output limits count real tokens, since "The
max_tokensparameter does not factor into OTPM rate limit calculations" (Anthropic, rate limits). Its limits refill continuously, as "a token bucket algorithm," so the budget recovers a little between calls, with no minute boundary to wait for.
Anthropic's page adds a line worth reading twice, that the published limits "represent maximum allowed usage, not guaranteed minimums." So the number on the page is the most you can use, and nothing guarantees you'll get it.
The agent's nightly job shares a key with chat, so it spends the same budget. Section 6 comes back to that at 2 a.m.
A 429 is several different errors
M9 sorted failures by what the code can see and retried the ones that can succeed later. When you're running the service, though, it's worth knowing which kind of 429 you're looking at, because two of them mean the traffic plan is wrong:
| What comes back | What it means | What helps |
|---|---|---|
429 with retry-after, limit exceeded | You're over requests or tokens per minute | Back off, then raise the tier or spread the load |
429, OpenAI slow_down | "Your request rate increased too quickly" | Ramp more gently, as below |
| 429 from an Anthropic acceleration limit | "A sharp increase in usage" | Ramp gently, or keep a steady share of traffic on the path |
| 429 from a spend cap or billing problem | Nothing to wait for | Fix the account. OpenAI notes retry-after "does not mean that quota, billing, or other errors that require user action can be resolved by retrying" |
503 server_is_overloaded (OpenAI), 529 (Anthropic) | The provider is overloaded, whatever your usage | Retry with backoff, then fall back (M9) |
Both providers also limit how fast you can ramp up. OpenAI's rule of thumb is that "once your traffic reaches 1 million input tokens per minute (TPM), increase it by no more than 50% every 15 minutes," and says the exact point where it applies varies. Anthropic asks customers to "ramp up your traffic gradually and maintain consistent usage patterns." Valentine's morning doesn't ramp gently, which is why the increase has to be arranged before the week, and why moving all traffic to a second provider in one minute goes badly (Part 2).
The lab can change the model under you
M4 covered aliases against dated snapshots and why to pin one. On top of that, labs retire old models. They do give notice, though it's shorter than most product roadmaps, since Anthropic gives "at least 60 days' notice before model retirement for publicly released models" (Anthropic, deprecations). And pinning an id doesn't freeze the model's behavior either, which M4 showed when the same prompt answered differently weeks apart.
So part of every release is something nobody on your team deployed, and Part 2 builds the rest of the release process around that.
Request path
Pick the request path from who's waiting
On your laptop, a model call is a function that returns an answer. In production the same call sits behind a load balancer and a worker pool, with a browser at the far end, and each of those gives up after its own time limit. The flower company met this twice in one week. Replies that needed long reasoning cut off at exactly 60 seconds, and the nightly summarization job died behind the gateway it ran through.
Which path a feature needs comes down to two questions, how long the work takes and whether a person is waiting for it.
| Path | Use it when | What it costs you |
|---|---|---|
| Synchronous | The work is short and someone is waiting | One held connection per request, and a hard ceiling on how long it can run |
| Streamed | Someone is waiting and the answer is long | The same held connection, plus errors that arrive after a 200, and output the customer sees before any check on it |
| Async job | The work takes minutes, or the caller can come back | A job store and a way to report status, plus a client that can wait |
| Provider batch | Nobody is waiting and a day is fine | A turnaround window you don't control, and results that come back out of order |
For the flower agent, chat turns are streamed, and a tool call in the middle of a turn is synchronous. The nightly summaries belong on the async path, so that's where they move now.
Both providers support the async shape directly. OpenAI's background mode returns a response in a queued state that you poll until it reaches a terminal one, and its webhooks retry "for up to 72 hours with exponential backoff" if your endpoint doesn't answer, which is a promise your handler has to be idempotent to survive (OpenAI, background mode, webhooks). Batch is cheaper and slower. OpenAI's Batch API is documented as a "50% cost discount compared to synchronous APIs," with "a separate pool of significantly higher rate limits" and a 24-hour turnaround, where each request carries a custom_id you match results on (OpenAI, batch). Both as of September 2026.
The shortest limit in the path wins
Every hop between the customer and the model has its own time limit, and the one that cuts you off first is usually one you never chose. An AWS Application Load Balancer defaults to a 60-second idle timeout, and idle is the operative word there, since it only fires when no bytes have moved for that long (AWS). Cloud Run is more generous, with a request timeout that "is set by default to 5 minutes (300 seconds) and can be extended up to 60 minutes (3600 seconds)" (Google Cloud). Browsers and corporate proxies then add limits of their own that you never get to see.
So you can end up in a situation where the model is quite happy to think for 70 seconds before producing a first token, and the load balancer closes the connection at 60. One fix is to send something during the silence, which for server-sent events means a heartbeat or a comment line every few seconds, so the connection never looks idle. The other is to move the work onto the async path and let the customer's browser poll for it. The flower agent does the first for chat and the second for summaries.
One deadline, propagated down
If each layer sets its own timeout without knowing about the others, the numbers never line up. Google's SRE book recommends deadline propagation, where "a deadline is set high in the stack (e.g., in the frontend)" and every call below inherits the same absolute deadline, minus what's already been spent (Google SRE, addressing cascading failures).
M9 set the flower agent's turn budget at 20 seconds and split it across attempts. Now every other layer has to respect those 20 seconds. The load balancer's idle timeout has to exceed it, the worker's own client timeout has to be under it, and each hop passes on the time that's left, so no hop starts a fresh clock. Work that can't finish inside the remaining time gets dropped at the point it's discovered, since a request that will miss its deadline is work you've already lost.
There's one more thing people forget. When a customer closes the tab, nothing tells the provider, so tokens keep being generated and billed until your code closes the stream. The handler that notices the disconnect has to cancel the call.
Capacity and admission
Capacity is arrival rate times time in the system
Nothing changed on the evening of the 12th except the provider's speed. Calls that took about 4 seconds took 12, traffic stayed where it was, and within a few minutes customers were waiting 40 seconds and then seeing errors. The reason is one line of queueing theory that AWS states plainly, "the concurrency in a system is equal to the arrival rate multiplied by the average latency of each request. For example, if a server was processing 100 messages / sec at 100 ms average, it would consume 10 threads on average. If the latency suddenly spiked to 10 seconds, it would suddenly use 1,000 threads" (AWS Builders' Library).
That's called Little's law, L = λW, and for an AI feature it helps to apply it at three levels at once.
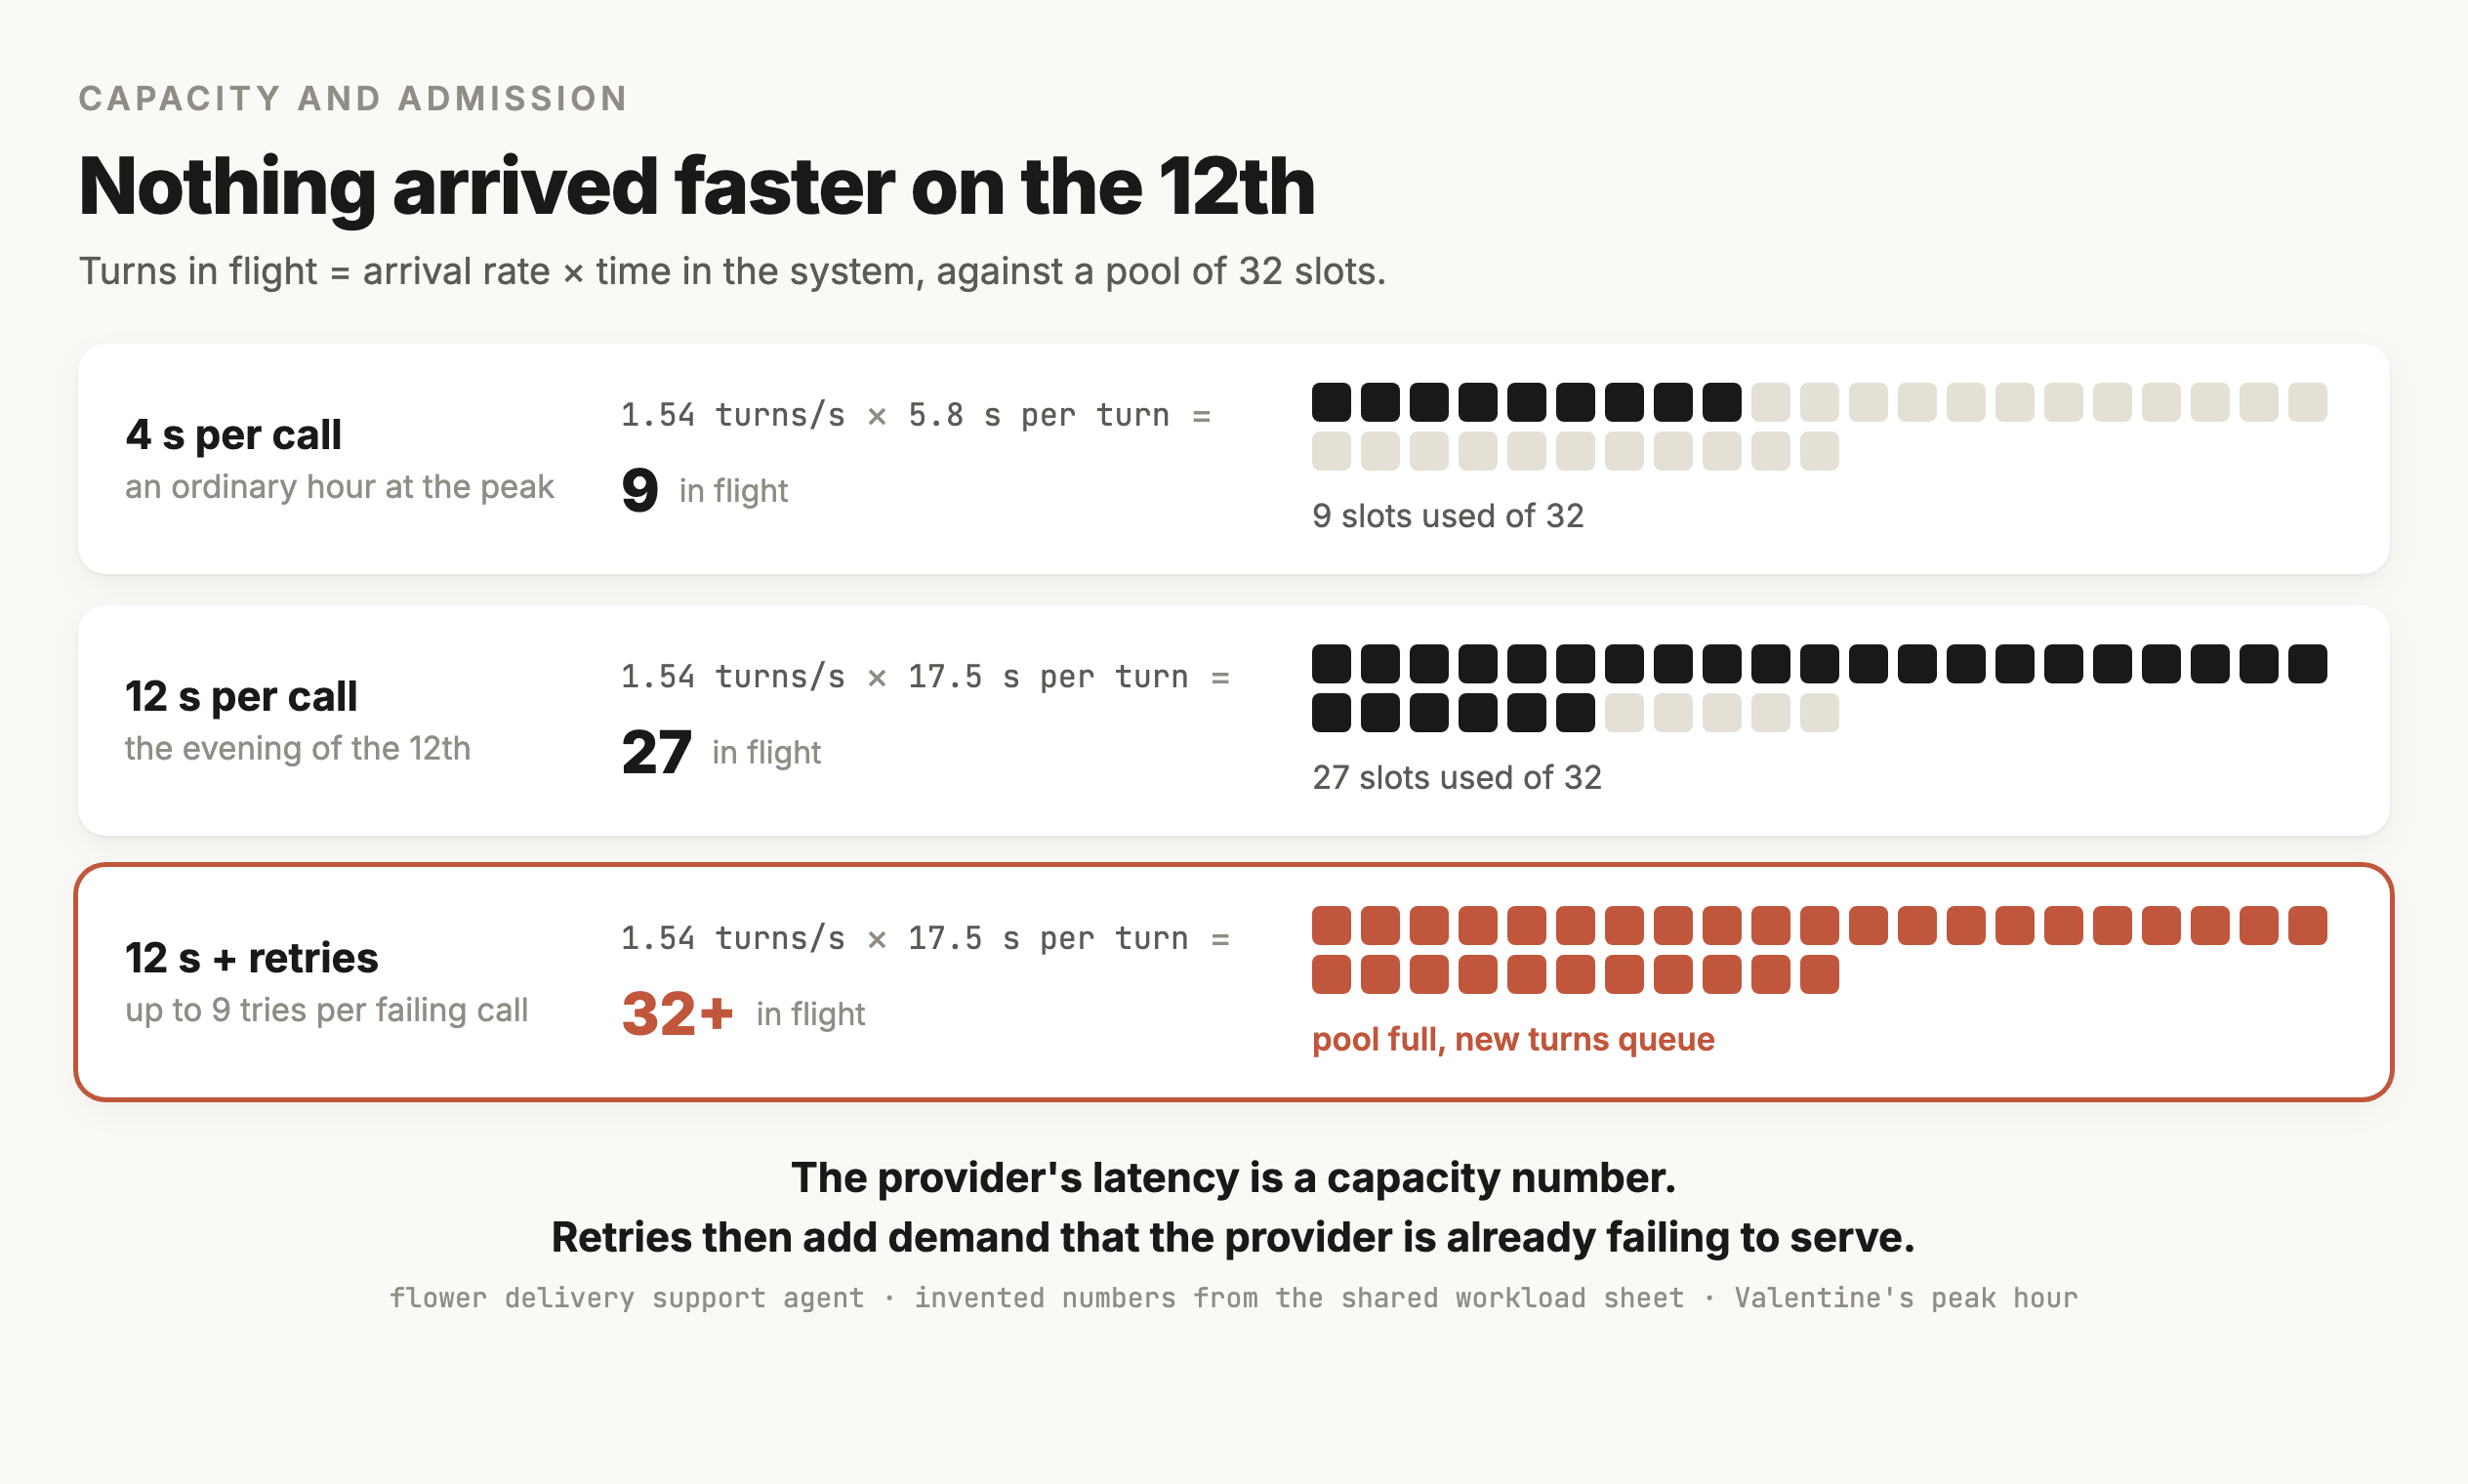
Counted as turns, about 1.54 a second arrive at the peak. A turn is roughly 1.5 model calls, so when a call takes 4 seconds a turn lasts about 5.8 seconds and roughly 9 of them sit in the system at any moment. When a call takes 12 seconds, the same turn lasts 17.5 seconds and 27 are in there.
Counted as model calls, that is about 2.2 a second at the peak, which comes to 9 in flight at 4 seconds and 27 at 12. Each one of those is a held connection and a worker slot that can do nothing else while it waits.
Counted as tokens, it is about 134 calls a minute carrying roughly 1.7M input and 75k output. What that costs you against a rate limit depends on whose limit it is. Counted the way Anthropic counts it, only the uncached input lands, which is about 127k a minute. Counted the way OpenAI counts it, the whole 1.8M lands, plus whatever max_tokens reserves on top.
Those numbers are made up, like the company's other numbers, and the shape of it transfers even when the numbers don't. A latency increase with no traffic increase is a capacity event, and the prompt cache from M5 is a capacity control as well as a cost control, because on a provider that excludes cache reads it decides whether you're at 127k or 1.7M tokens a minute.
When the pool fills, latency becomes an availability problem
When the pool fills, new requests queue behind the in-flight ones. Their wait grows on top of the provider's, so the customers at the end of the queue get an answer after they've given up. AWS puts the arithmetic in one sentence, "If the service's median latency is equal to the client timeout, half of the requests are timing out, so the availability is 50 percent" (AWS, load shedding).
The same article separates throughput, everything you accept, from goodput, "the subset of the throughput that is handled without errors and with low enough latency for the client to make use of the response." On the evening of the 12th the service's throughput looked fine, and its goodput was collapsing.
The fix is admission control, which means deciding which requests to accept once you're full.
Bound the queue by age as well as by length. A chat request that has been waiting 90 seconds is worthless to the customer even if it eventually succeeds, so drop it and tell them, and spend that worker slot on something still worth finishing.
Reject early and cheaply, with a 429 or a 503, as soon as the pool is full. That way the caller finds out immediately, which is worth more to them than a slow failure.
And shed by class, so that when something has to be dropped you have already decided what. Google's SRE book does this by giving every request a criticality, with batch work defaulting to SHEDDABLE_PLUS, "traffic for which partial unavailability is expected" (Google SRE, handling overload). Interactive chat outranks the nightly summaries every time.
Shedding also messes with your metrics, because rejections are fast and they drag the median latency down. AWS notes that a service shedding 60% of its traffic "might look pretty amazing" on median latency while the requests it served are terrible. Keep shed requests out of the latency you report on served traffic.
Retries multiply across layers
M9 set the retry policy for one call, which errors to retry and how long to wait. Once you're running a real service, you also have to ask how many layers are retrying. That evening, the harness had three tries around each call and the SDK inside it still had its default of two, so a failing turn sent the same request up to nine times.
At the peak that turns 2.2 calls a second of demand into about 20 a second arriving at a provider that's already struggling. Put an automatic retry in the frontend as well and it's 40. AWS's canonical version is a stack of five layers each retrying three times, where "the load on the database will increase 243x, making it unlikely to ever recover" (AWS, timeouts, retries and backoff).
Retry in one layer only. Pick the layer that knows enough to make the decision, which is usually complete(), and turn retries off everywhere else. The provider SDKs count as a layer here, and both of the big ones retry by default, so leaving them alone means you have two layers before you have written any code.
Give the retries a budget. Google's SRE book has each client track the ratio of retries to requests and stop retrying once that goes above 10%, which "reduces the growth to just 1.1x in the general case."
And do not retry what cannot succeed. A spend-cap 429 and a malformed request will fail the same way every time you send them, which is M9's sorting of failures applied at the level of the fleet.
Async work
A queue keeps work safe and can hide an overload for hours
The nightly job summarizes every ticket closed that day for the support team's morning list. It went on a queue with twenty workers, which is the right shape for it. During Valentine's week it ran into three separate problems, and each one is something people usually learn about queues the hard way.
The same work ran twice
A queue hands a message to a worker and hides it for a while, and if the worker doesn't delete it in time the message comes back for someone else. Amazon SQS calls that window the visibility timeout, where "The default visibility timeout for a queue is 30 seconds," extendable during processing with ChangeMessageVisibility up to "a maximum limit of 12 hours from when the message is first received" (AWS, SQS).
A model call that takes 6 seconds on a normal night takes 20 on a slow one, and any call that outlasts the visibility timeout gets its message redelivered while the first worker is still running it. The ticket is summarized twice and billed twice. At scale it gets worse, as AWS puts it, because "When system latency crosses that VisibilityTimeout threshold, it causes an already overloaded service to essentially fork-bomb itself" (AWS, queue backlogs).
You need two fixes, and they work together. First, set the timeout comfortably above the p99 call time, or keep extending it with a heartbeat while the call runs. Then make the work idempotent, with M6's key built from the ticket id, so a redelivery writes the same summary once.
The backlog grew all day and nothing alarmed
Queue depth alone says little, since a queue of 500 that drains in a minute is healthy and a queue of 50 that hasn't moved in an hour isn't. The number to watch is the age of the oldest message, and the number to reason with is recovery time, which is backlog divided by spare capacity. AWS's version is worth keeping in your head, that after an hour-long outage, "recovering from the outage requires double the system's capacity for another hour after the recovery."
A queue also needs somewhere for poison messages to go. After a few failed receives, the message moves to a dead-letter queue, whose retention should be longer than the source queue's so the evidence outlives the incident. An alarm on any message landing there is worth having, and it's a late signal, since the message has already failed several times by then.
If you put interactive work on a queue, there's one more rule. A chat request that has waited 90 seconds is worthless, so give queued interactive work a time to live and drop what's past it.
Chat started failing at 2 a.m.
The third problem had nothing to do with the queue's mechanics. The workers used the same API key as chat, so the summaries and the customers drew from one pool of tokens per minute, and at 2 a.m. the job won.
The fix is to keep the two apart, and you can do that more or less strongly. The weakest option is a separate project or key for the batch work, with limits of its own, so that the two paths cannot spend each other's budget.
Stronger than that is the provider's own batch API, which is a different pool entirely. OpenAI's is documented as having "a separate pool of significantly higher rate limits," at half the price, with a 24-hour turnaround.
The strongest is priority by class, so that when something has to lose, it's the nightly job that loses. It's the same criticality idea from section 5, applied to your own queue.
The summaries moved to the provider's batch API, which suits work that nobody is waiting for and costs half as much. The knowledge-base sync from M6 stayed on its own queue with its own key, since it has to be reasonably fresh.
Hosting
Where the model runs decides what you're on call for
Two questions arrived during the same week. A corporate customer asked whether their order data could stay inside the EU, and finance asked whether hosting an open model would be cheaper. Both come down to the same question, which is how much of the serving stack the team wants to run itself.
| Option | What you get | What you now operate |
|---|---|---|
| Provider API, standard tier | Fastest to ship, best-effort capacity | Your app, and nothing else |
| Provider API, priority or provisioned tier | Reserved or prioritized capacity, sometimes with an SLA | The commitment, and the sizing behind it |
| Cloud-hosted proprietary model (Bedrock, Vertex, Foundry) | Regional endpoints, under your cloud's billing | Quotas per region, and a second set of limits to learn |
| Managed hosting of open weights | A model you chose, on someone else's serving stack | Instance sizing and scaling, with the weights as a deploy artifact |
| Self-hosted serving on your own GPUs | Full control of the model and the data path | Everything below, forever |
The last rung is where your on-call rotation changes, because once you self-host, a few problems become yours to solve.
Memory comes first, and the arithmetic is unforgiving. Weights come to roughly parameters multiplied by bytes per parameter, so a 7B model at 16-bit precision is about 14 GB and a 70B model is about 140 GB, which no single 80 GB card holds. On top of the weights sits the key-value cache, which grows with every token of every concurrent request, and serving engines reserve a share of GPU memory up front to hold it.
Then there's batching. Serving engines run many sequences together, which raises throughput and makes any individual request slower, so a latency target and a throughput target end up pulling in opposite directions on the same knob.
Then there's deciding when to scale, and the obvious metric for it is a poor one. Google's guidance for GKE says GPU utilization "Measures the duty cycle, which is the amount of time that the GPU is active. Does not measure how much work is being done while the GPU is active," and points at server-level metrics like queue size and batch size (Google Cloud).
And startup catches people out. Pulling an image, downloading tens of gigabytes of weights and loading them into GPU memory takes minutes, and Kubernetes needs a startup probe to cover that window, since "If a startup probe is configured, Kubernetes does not execute liveness or readiness probes until the startup probe succeeds" (Kubernetes). Without one, the liveness probe kills the container part-way through loading and it restarts forever.
M4 showed that pointing complete() at a self-hosted server behind an OpenAI-compatible URL is a one-line change. This section is about everything that sits behind that URL once you make the change. M12 works out when the cost favors it, and M26 covers the serving internals.
Packaging
Ship one image and inject the config when it starts
Two smaller things came out of the review that week. Staging and production behaved differently often enough that nobody trusted a staging test, and the production API key turned out to be baked into the container image.
Ship one image and promote it by digest, so the same bytes that passed staging are the bytes running in production, and record that digest in the release notes. Anything looser means you tested one artifact and shipped a different one.
Config comes from the environment, with none of it baked into the image. The twelve-factor rule is "strict separation of config from code," and it comes with a litmus test worth applying to your own repository, which is "whether the codebase could be made open source at any moment, without compromising any credentials" (The Twelve-Factor App).
Secrets come from a secret manager, which means neither from the image nor from a plain environment variable. If you are using Kubernetes Secrets, be clear about what they are, because Kubernetes' own documentation says "Kubernetes Secrets are, by default, stored unencrypted in the API server's underlying data store (etcd). Anyone with API access can retrieve or modify a Secret" (Kubernetes). M10 owns which keys exist and how narrow their permissions are, and this is the point where they get mounted.
Give each environment its own provider project. Separate keys mean separate rate limits and separate spend, which is what stops a load test in staging from eating production's tokens per minute.
And make readiness mean that this particular replica can serve, which means the probe checks the process and its own dependencies. A readiness check that calls the model provider will take every replica out of rotation at the same moment the provider slows down, turning a degraded hour into a full outage.
Putting it together
Putting it together
What broke in Valentine's week were the assumptions the code was written under, while the agent's own logic held up. Every one of those assumptions came from the model call being slow and metered, with its limits and its versions set by the lab that runs it.
The load side of that comes down to a handful of numbers a team should be able to produce on request:
| Question | The flower agent's answer | Where it came from |
|---|---|---|
| Arrival rate at the peak | 1.54 turns a second, about 2.2 model calls | Section 2 |
| Time in the system per turn | 5.8 s normally, 17.5 s at a slowed provider | Section 5 |
| Work in flight | About 9 turns, about 27 when slowed, against 32 slots | Section 5 |
| Tokens a minute at the peak | 1.7M input, 127k of it uncached, 75k output | Sections 3 and 5 |
| Which limit binds first | Uncached input on one provider, total tokens plus max_tokens on another | Section 3 |
| What happens when the pool fills | Reject with 429 at the door, shed batch before chat, drop work past its deadline | Section 5 |
| How many retry layers exist | One, in complete(), with the SDK's own retries off | Section 5 |
| Where long work runs | Provider batch for summaries, its own queue and key for the sync | Section 6 |
| What is deployed | One image by digest, with config and secrets injected at start | Section 8 |
Part 2 takes the other half of the week, where the agent stayed up and the answers got worse, and nobody could say what had changed.
Checkpoint · recall · 5 questions
What the module said
- 01
Which change cuts the time a reply takes more, trimming 500 tokens of prompt or cutting 10 tokens off the answer?
- 02
What does Little's law say about a provider that slows from 4 seconds to 12 with traffic unchanged?
- 03
On Anthropic's limits, which tokens count toward the input limit?
- 04
A queue's visibility timeout is 30 seconds and the p99 model call takes 45. What happens?
- 05
Why is GPU utilization a poor signal for autoscaling a self-hosted model server?
0 / 5 answered
Checkpoint · understanding · 5 questions
Reason it through
- 01
A support reply thinks silently for 20 seconds, then streams text for 10. It dies behind a load balancer with a 60-second idle timeout. Why, and what fixes it?
- 02
After adding a retry in the frontend, a five-minute provider blip turned into a forty-minute outage. What happened?
- 03
Your peak hour needs about 1.7M tokens a minute and your tier allows 2M. Marketing wants a campaign that doubles traffic for one hour. What do you check first?
- 04
A corporate customer asks that their order data stay inside the EU. Which move is the smallest change that can satisfy it?
- 05
Your readiness probe calls the model provider with a two-word prompt. Why is that a bad idea?
0 / 5 answered
Checkpoint · debugging · 4 questions
Debug it
- 01
Replies are getting cut off at exactly 60 seconds, always at 60, never at 58 or 62. Where do you look first?
- 02
The chat endpoint starts returning 429s at 2 a.m., when chat traffic is at its lowest. What's the likely cause?
- 03
Summaries appear twice for about 2% of tickets overnight, and all of them are long tickets. What's happening?
- 04
During a provider slowdown, every pod went unready within a minute and the load balancer returned 503 to everyone, including customers whose turns would have succeeded. What's wrong?
0 / 4 answered