
What it is
Images and captions become vectors in one space, and you compare them
Feeding an image through the image encoder gives a vector. Feeding a sentence through the text encoder gives a vector of the same size. The cosine similarity between them is a single number, and the whole method follows from that.
To classify with no training, you write one short caption per class and embed them once, then take the caption whose vector is closest to the image's. To search a library, you embed every image once, then embed the query text and return the nearest images.
Scoring five images against five captions with the smallest CLIP model puts real numbers on that.
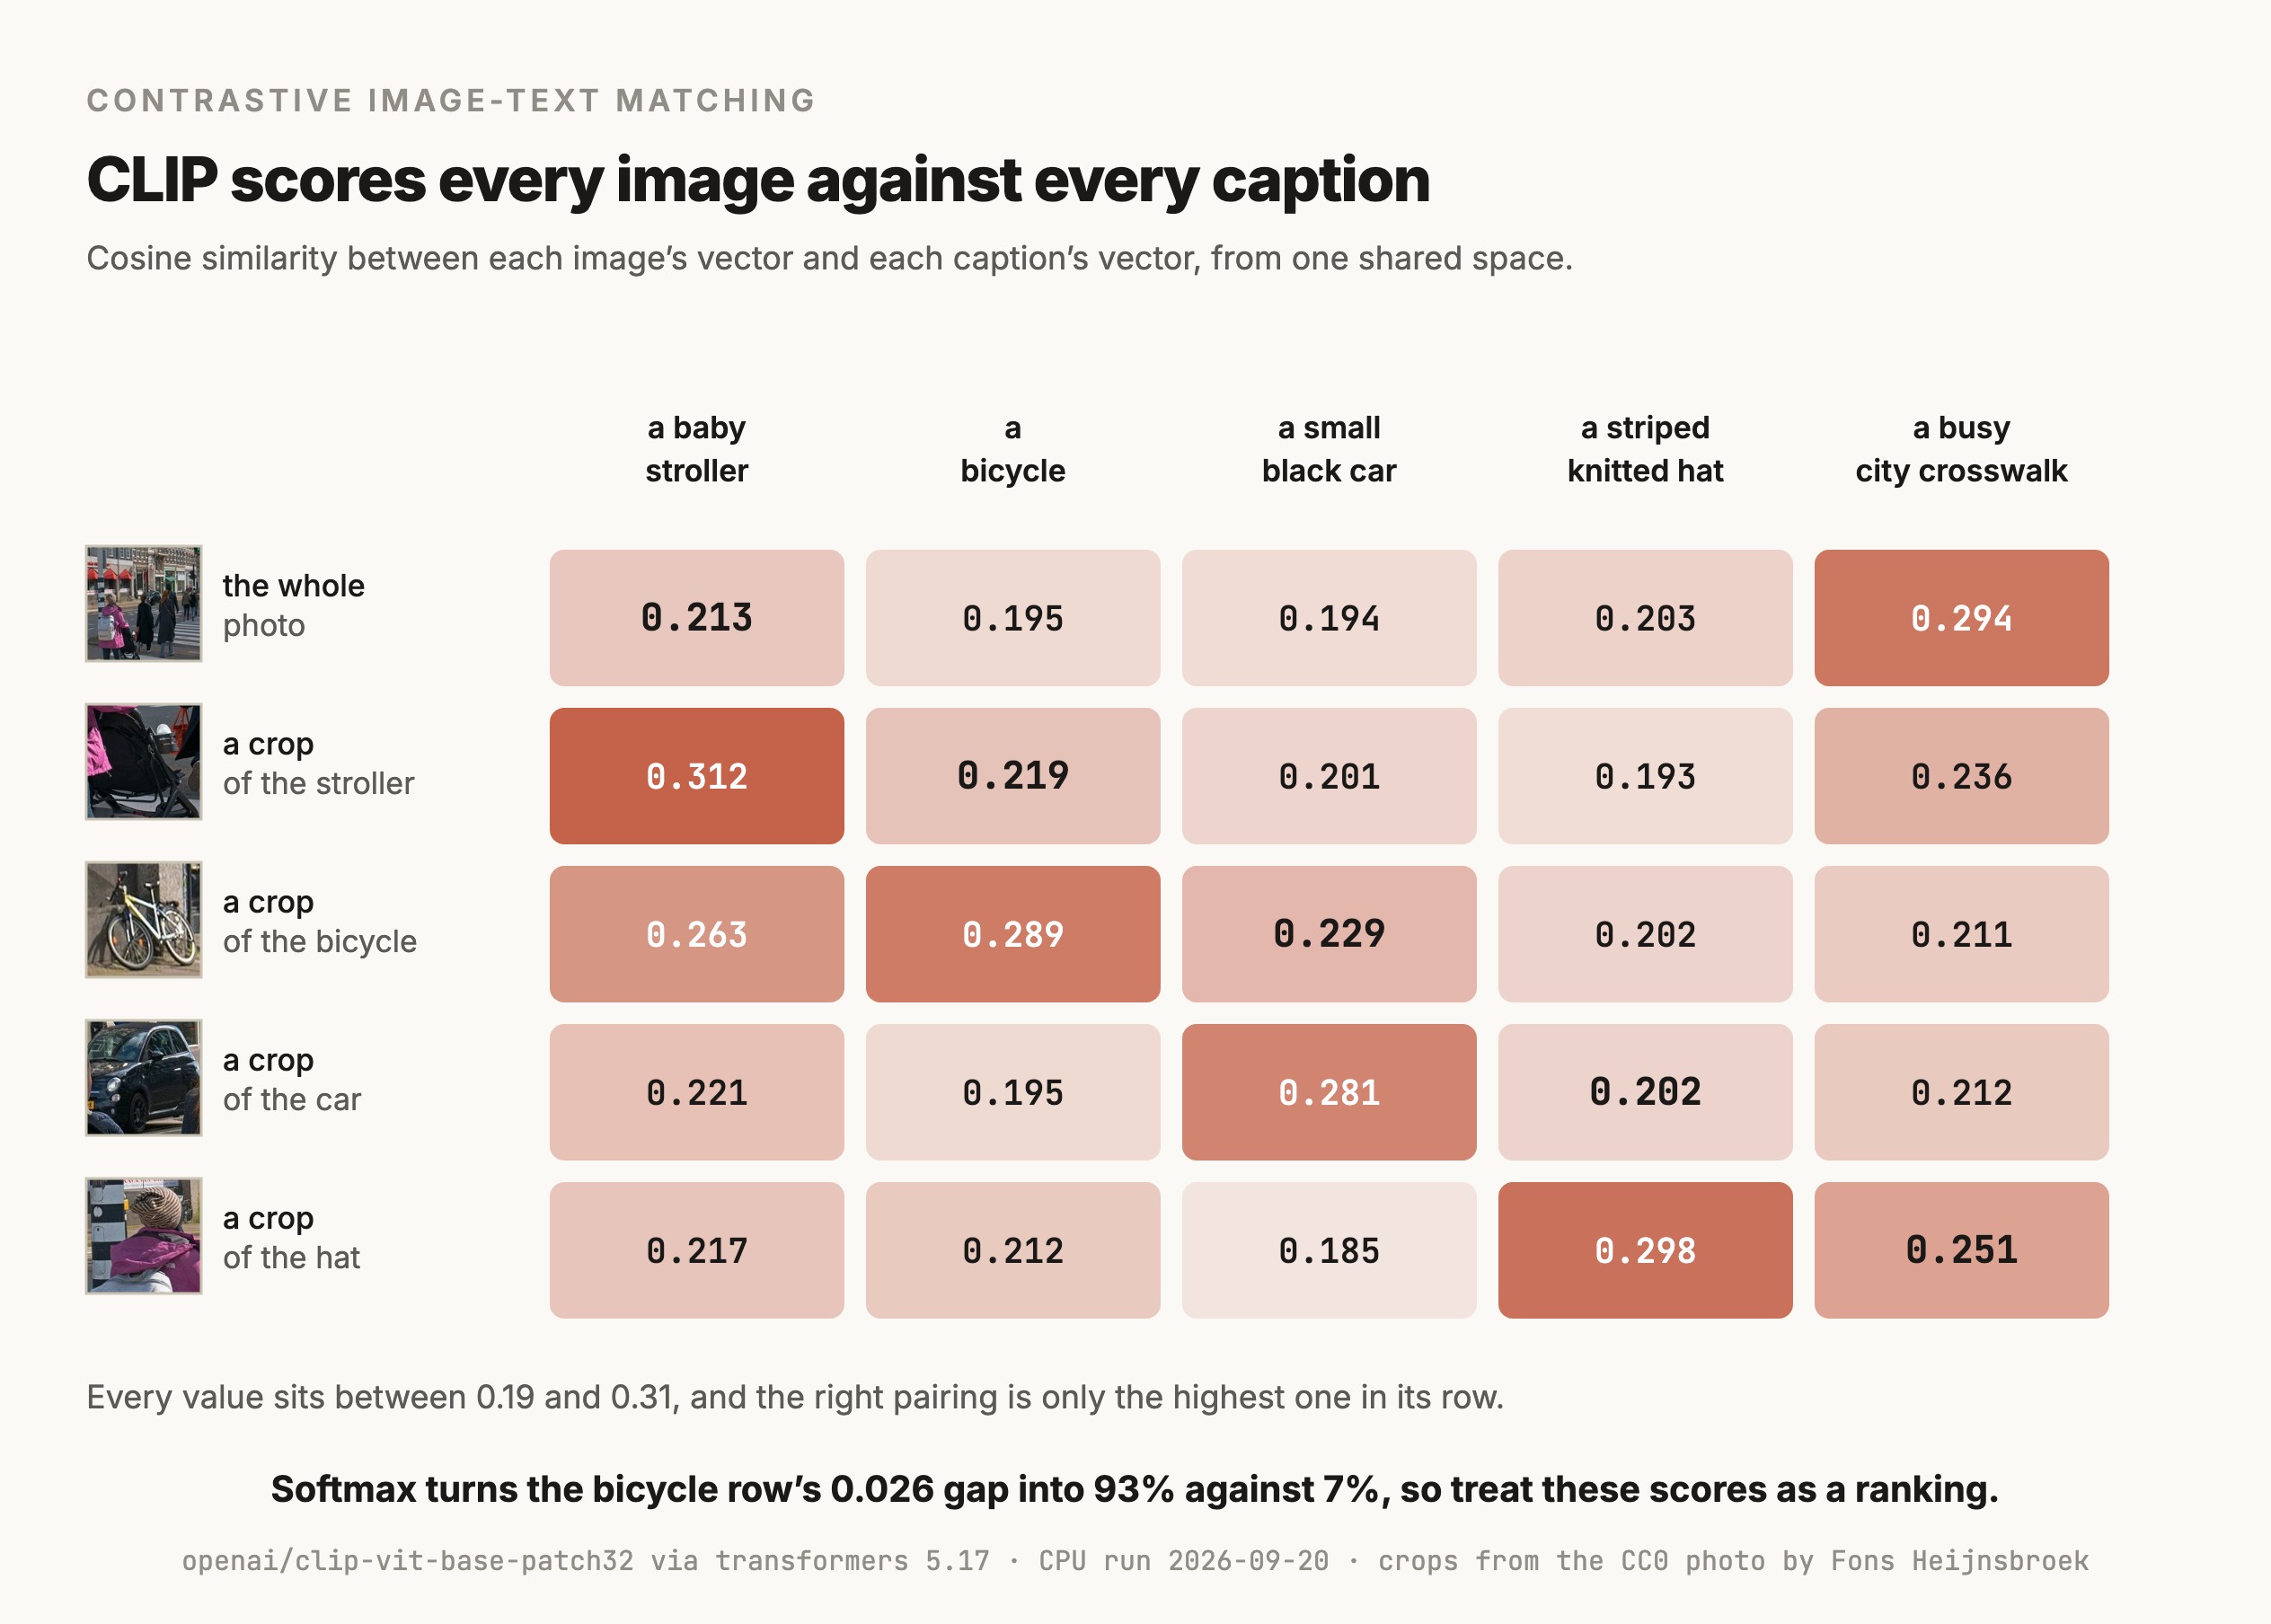
The right answer is always the highest score in its row, so ranking works. The numbers themselves sit in a narrow band, between 0.185 and 0.312, with no natural cutoff between "matches" and "doesn't". Libraries hide this by multiplying the scores by a scale learned during training and running a softmax over them, which turns the bicycle row's gap of 0.026 into 93% against 7%. Those percentages only compare the captions you supplied.
That narrow band has a cause, and you can see it by looking at where the vectors sit.
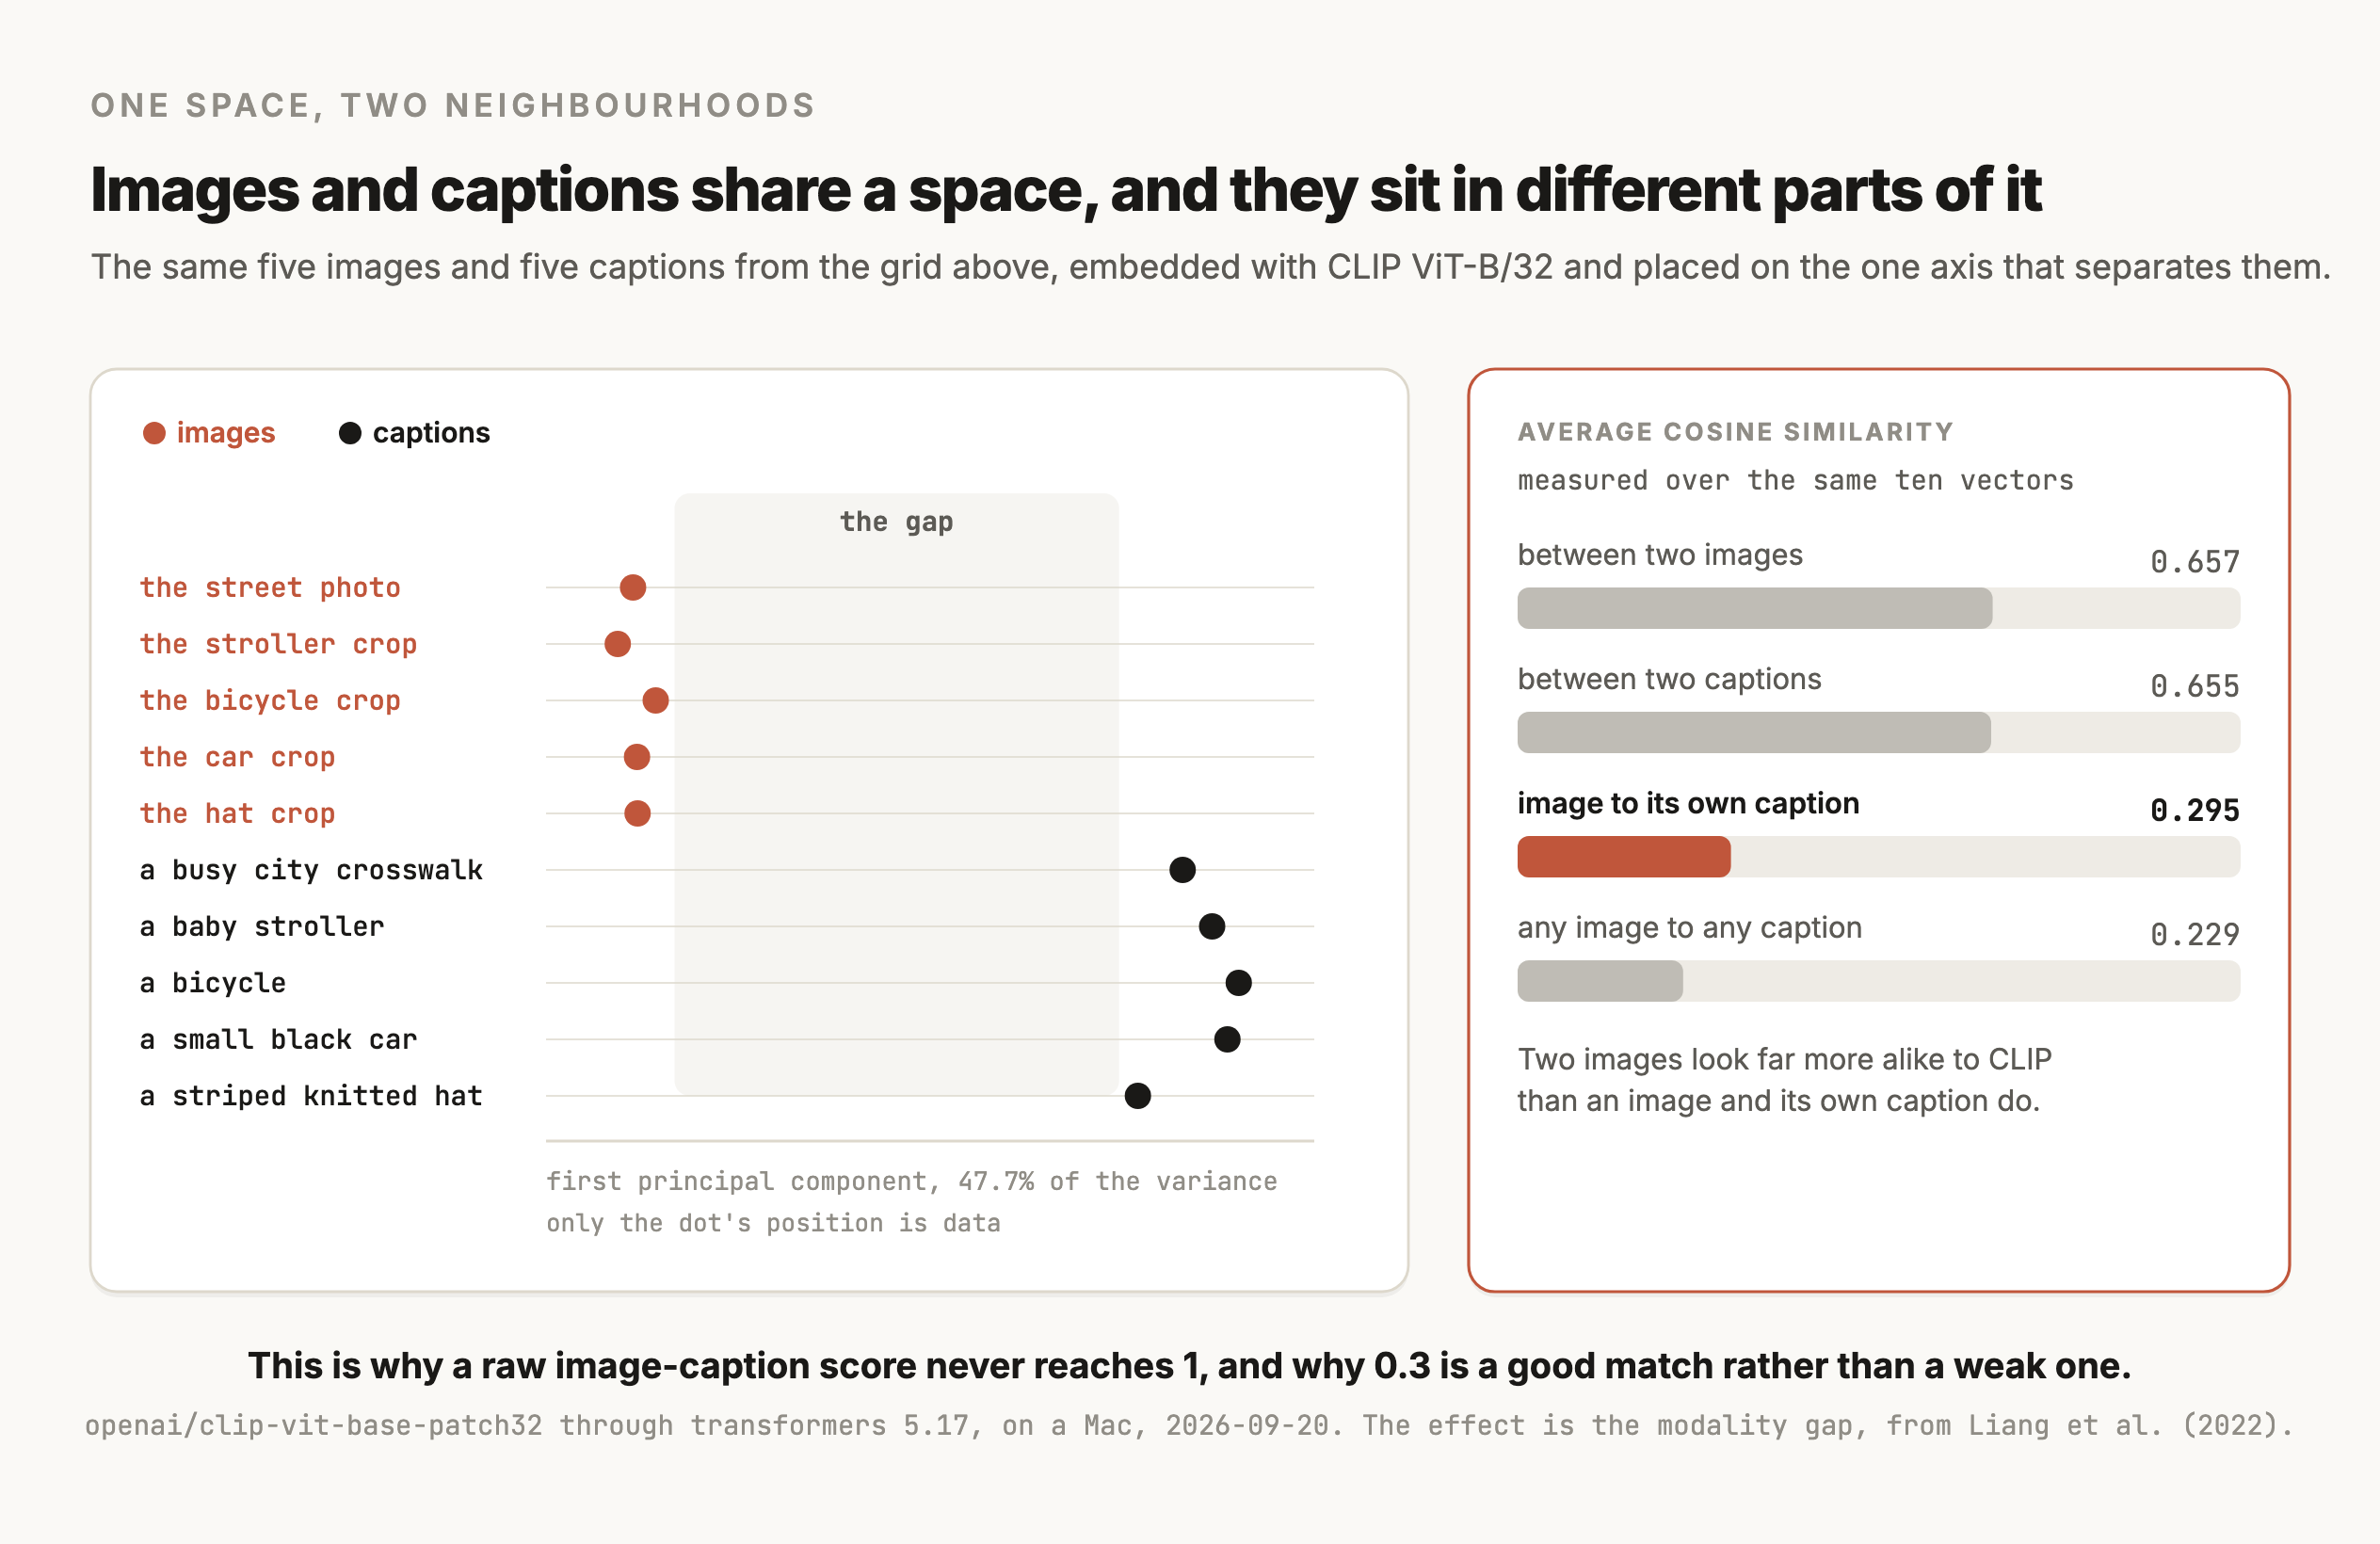
Two images average 0.657 with each other and two captions average 0.655, while an image and its own caption average 0.295. The image vectors and the text vectors occupy separate regions, and every cross-modal score you ever read is a comparison across that divide. Liang et al. (2022) named this the modality gap and traced it to how these models are initialized and trained, showing that the two modalities end up "embedded at arm's length in their shared representation".
Where it shows up
It shows up wherever text and images have to meet
Searching images with words
Embed a photo library once and keep the vectors in a vector database. A search for "a red bicycle leaning on a wall" embeds the query and returns the nearest images, with no tags or filenames involved.
Classifying without training data
Moderation triage, product categories, "is this a screenshot or a photo". You write the candidate captions, and you can change them tomorrow without retraining anything. Accuracy lands below a model fine-tuned on your labels, which is the trade you're making.
Filtering and deduplicating training data
CLIP similarity is a cheap way to check whether an image and its caption belong together. The LAION-5B dataset was built this way, dropping English pairs whose CLIP cosine similarity fell below 0.28.
Inside image generators
The text encoder that turns a prompt into vectors for an image generator often is CLIP's. Stable Diffusion 1.5's model card describes it as using "a fixed, pretrained text encoder (CLIP ViT-L/14)". The diffusion models article covers what happens next with those vectors.
Scoring generated images
CLIPScore (Hessel et al., 2021) uses the same similarity to judge how well a caption matches an image, and image generators are often compared this way. It inherits every weakness below, so it's a rough signal.
How it works
Training pulls matching pairs together and pushes the rest apart
CLIP was trained on 400 million image-text pairs collected from the internet. Each training step takes a batch of N pairs and computes all N × N similarities between the images and the texts in that batch. The paper describes the objective as training "to maximize the cosine similarity of the image and text embeddings of the N real pairs in the batch while minimizing the cosine similarity of the embeddings of the incorrect pairings".
So the model never learns class labels. It learns to rank the right caption above the other captions that happened to be in the batch, which is why bigger batches make the task harder and the features better. A learned temperature scales the similarities before the loss. In the code it's stored as a multiplier, logit_scale, and the paper capped it at 100 to keep training stable. That same multiplier later makes those confident-looking percentages.
The two encoders are ordinary architectures. The image side is a ResNet or a vision transformer, and the text side is a transformer over the caption's tokens, which makes both of them encoders. Each ends in a projection to the shared space, and the vectors are normalized to unit length, which is what makes their dot product a cosine.
Zero-shot classification then reuses the text encoder as a classifier builder. You embed "A photo of a {label}." for every label, and those vectors act as the weights of a classifier you never trained. The wording changes the result more than you'd expect. The paper found that adding "A photo of a" to a bare label improved ImageNet accuracy by 1.3%, and that prompt engineering with ensembles of several phrasings "boost zero-shot classification performance by almost 5 points on average across 36 datasets".
Versions
The versions you'll see, as of September 2026
| Model | From | Notes |
|---|---|---|
| CLIP | OpenAI, January 2021 | The original, MIT-licensed code and weights, from ViT-B/32 up to ViT-L/14 |
| OpenCLIP | LAION and collaborators | An open re-implementation with many checkpoints trained on open datasets |
| MetaCLIP | Meta | Published on Hugging Face as facebook/metaclip-*, trained with a data-curation recipe of its own |
| SigLIP | A CLIP-style model trained with a sigmoid loss in place of the batch softmax, covered in its own entry on this index |
The interface is the same across all of them, so swapping checkpoints is a one-line change, and the one to use is whichever scores best on your own images.
Choosing
Pick CLIP when words have to meet images, and a neighbor when they don't
| The job | Reach for | Why |
|---|---|---|
| Search or classify images using words you type | CLIP or SigLIP | Text and images share one space, so a caption is a query |
| Find visually similar images, with no text involved | DINOv2 or DINOv3 | Self-supervised features capture appearance more finely than caption-trained ones |
| Draw boxes around what a phrase names | Grounding DINO | CLIP scores whole images, and detection needs a detector |
| Answer a question about an image in words | A vision-language model | CLIP has no text decoder, so it can't write anything |
| Classify into fixed classes you have labels for | A fine-tuned classifier, which can start from CLIP features | Training on your labels beats zero-shot on a fixed task |
The CLIP-versus-DINO choice comes up often, and the figure above shows why it isn't obvious. CLIP's features are shaped by what captions mention, so two images described the same way look similar to it, even if they don't look alike. DINO's are shaped by appearance alone. Text search needs the first, and near-duplicate detection is usually better with the second.
Try it
How to try it
This is the code behind the figure, cut down to one image and a few captions.
import torch
from PIL import Image
from transformers import CLIPModel, CLIPProcessor

model = CLIPModel.from_pretrained("openai/clip-vit-base-patch32").eval()
proc = CLIPProcessor.from_pretrained("openai/clip-vit-base-patch32")

captions = ["a baby stroller", "a bicycle", "a small black car"]
inputs = proc(text=captions, images=Image.open("crop.jpg").convert("RGB"),
              return_tensors="pt", padding=True)

with torch.no_grad():
    out = model(**inputs)

cosine = (out.image_embeds @ out.text_embeds.T)[0]  # unit vectors, so cosines
scale = model.logit_scale.exp().item()              # 100.0 for this checkpoint
probs = out.logits_per_image.softmax(dim=-1)[0]     # cosine * scale, softmaxed
for caption, c, p in zip(captions, cosine, probs):
    print(f"{caption:20} cos {c:.3f}   {p * 100:5.1f}%")
The raw cosine comes from the two embeddings directly, and the scale is read from the checkpoint. OpenAI's weights sit at the cap of exactly 100, so dividing logits_per_image by 100 happens to work for them. Two fine-tuned checkpoints checked for this page read 99.79 and 99.96, and SigLIP adds a learned bias after the scale, so a hard-coded 100 gives slightly wrong cosines on the first two and wrong ones on SigLIP.
Build a text search over a folder of images with CLIP. Use openai/clip-vit-base-patch32 through transformers to embed every image once and store the normalized vectors with their paths in a FAISS inner-product index that persists to disk. Then give me a search function that takes a text query, embeds it with the same model, and returns the top 10 paths with their cosine similarities. Add an evaluation mode that takes a CSV of queries and the filename that should rank first, and reports top-1 and top-5 accuracy, and print the distribution of cosine similarities for correct and incorrect matches so I can see how much they overlap.
Limits
What it can't do
- Its scores only rank candidates. Every similarity in the figure sits between 0.185 and 0.312, so a fixed threshold like "0.3 means a match" doesn't transfer between image types or caption styles. Calibrate against your own labeled examples, or compare candidates and take the best.
- It needs a list of candidates. With no captions to compare against, there's nothing to rank, so it can't tell you what's in an image the way a captioning model would.
- One vector stands for the whole image. In the figure, the full street photo scores 0.213 for "a baby stroller" even though a stroller is in it, because the vector describes the scene. Small objects need crops or a detector.
- Word order and relations get lost. Yuksekgonul et al. (2022) built the ARO benchmark and found CLIP-style models behave "like bags-of-words", so "a person on a horse" and "a horse on a person" can score almost the same.
- Text printed in the image pulls the score. In a test for this page, writing the word "bicycle" across the stroller crop moved the "a bicycle" caption from 0.0% to 25.9% and its cosine from 0.219 to 0.273. Goh et al. (2021) showed stronger versions of this effect, which they called a typographic attack.
- It's weak at counting and fine-grained distinctions, like the exact model of a car or the number of objects in a photo, which the paper's own limitations section covers.
- It carries the biases of its training data. The original weights come from web images and captions collected up to 2021, with the paper devoting a section to the biases that survive in the model.
Go deeper
Radford et al. (2021): Learning Transferable Visual Models From Natural Language Supervision (CLIP) · Goh et al. (2021): Multimodal Neurons in Artificial Neural Networks · Yuksekgonul et al. (2022): When and why vision-language models behave like bags-of-words · Hessel et al. (2021): CLIPScore, a reference-free evaluation metric for image captioning · Liang et al. (2022): Mind the Gap, Understanding the Modality Gap in Multi-modal Contrastive Representation Learning · OpenAI's CLIP repository (MIT license)
Coming soon
New modules go live as I write them. Get each one in your inbox the day it ships. No spam, just the next lesson.